
Chart templates
Free Chart Templates
34 editable templates with real sample data
Each template pairs a realistic dataset with a finished chart, from sales pipelines and budget vs actual to employee turnover and NPS trends. Open one in the InstaCharts chart maker, replace the sample rows with your own data and export, share or embed the result.
- 34 free templates
- 8 industries
- No account needed
Marketing Campaign Performance
Marketing Chart Templates
Marketing teams report on spend, traffic and conversions every week. These templates cover the charts that show up most in campaign reviews and client reports, each one loaded with realistic sample data you can replace with your own.
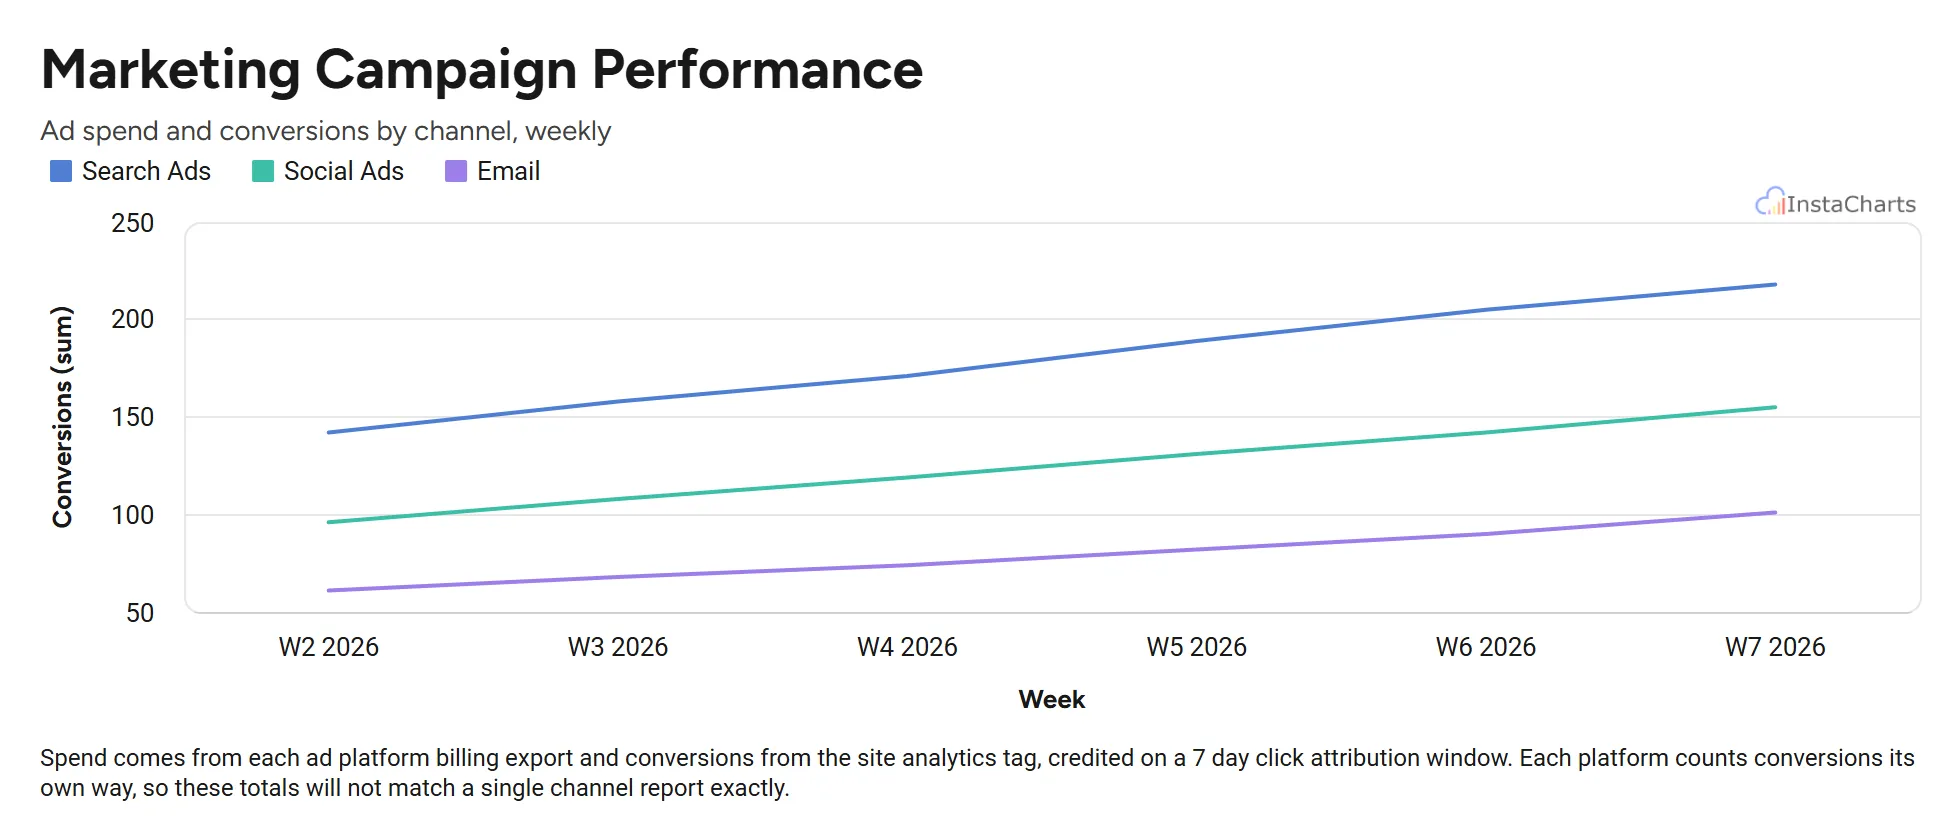 Grouped Line Chart
Marketing Campaign Performance
Weekly ad spend and conversions for search, social and email campaigns over a six week period.
View template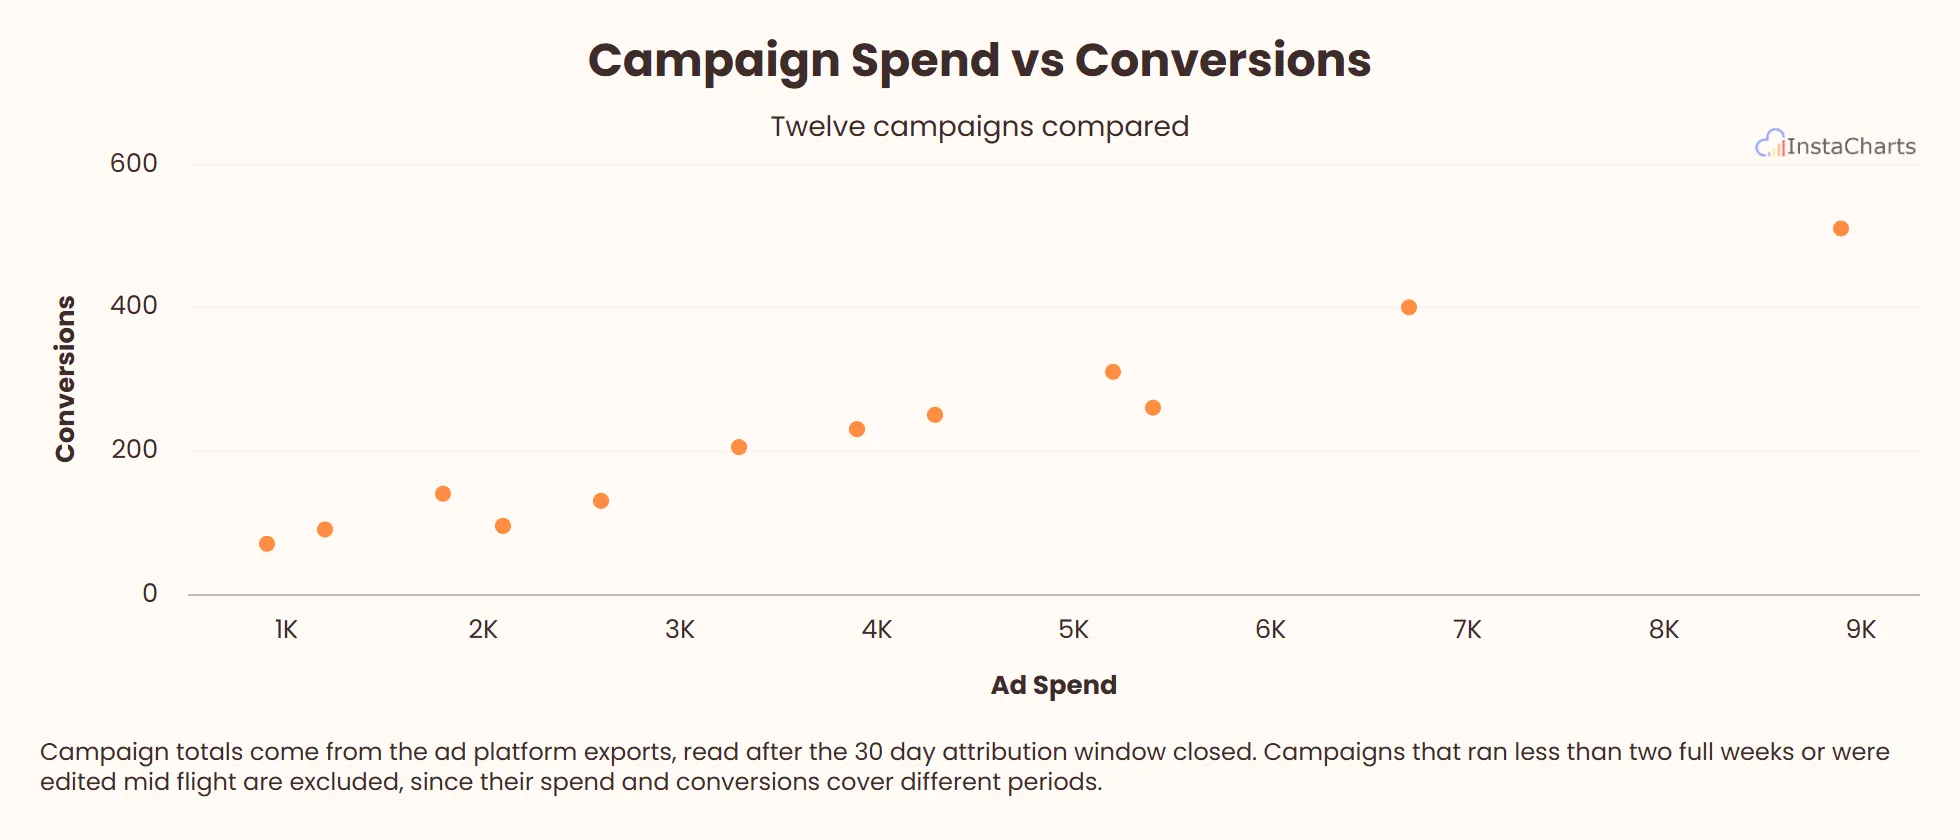 Scatter Plot
Campaign Spend vs Conversions
Ad spend and conversions for twelve marketing campaigns, useful for spotting which campaigns return the most value.
View template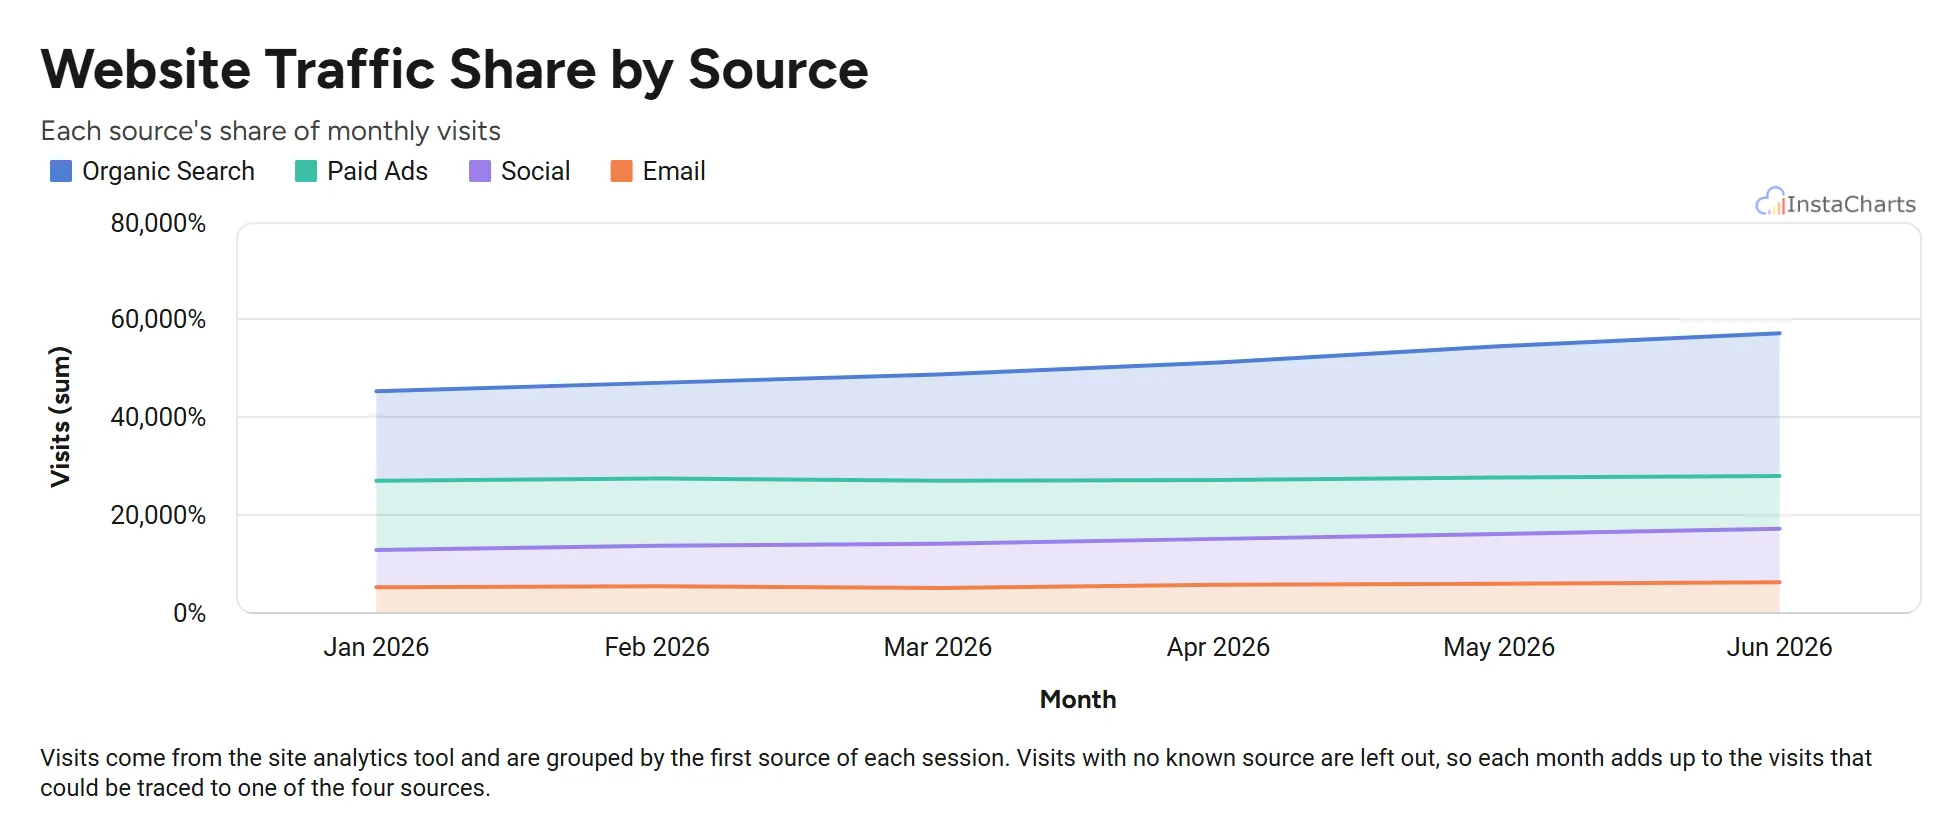 100% Stacked Area Chart
Website Traffic Share by Source
Monthly website visits from organic search, paid ads, social and email, scaled to 100 percent to show how the mix of sources shifts.
View template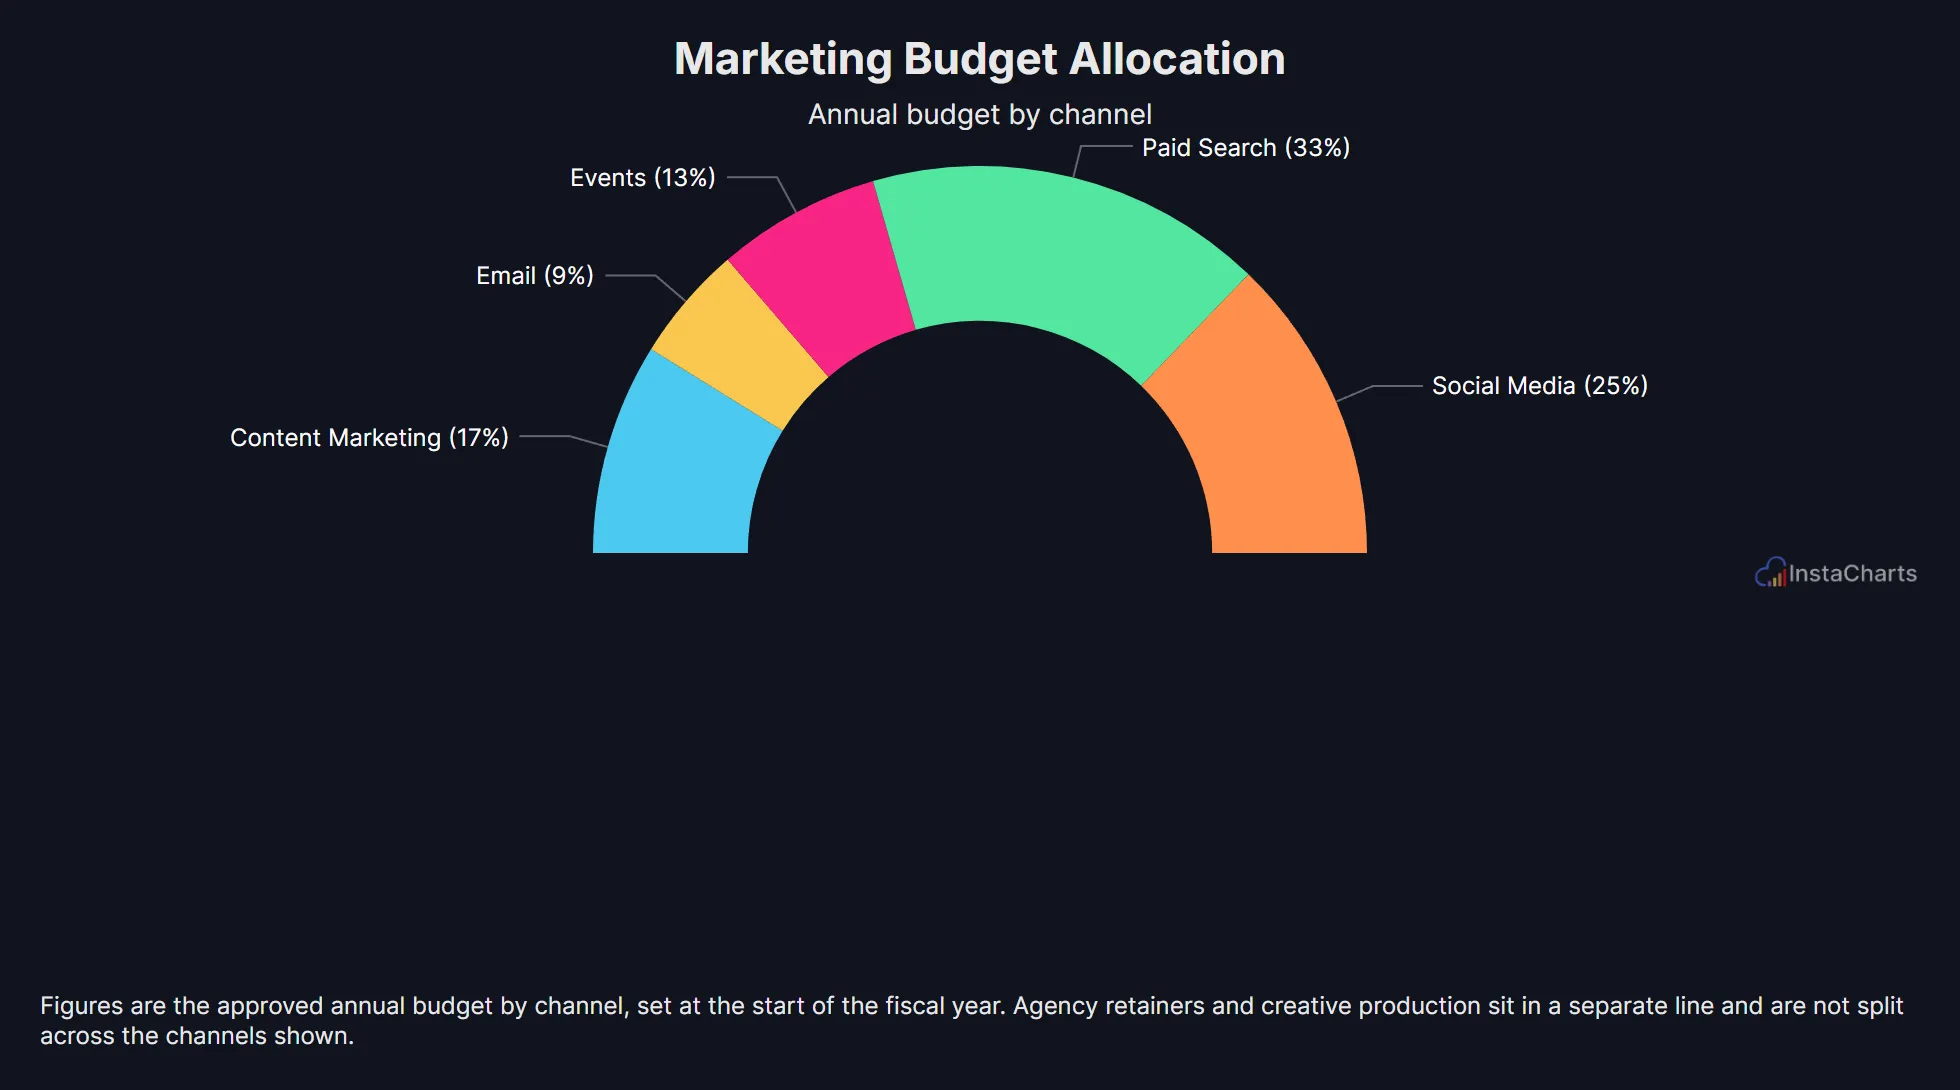 Semi Circle Donut Chart
Marketing Budget Allocation
Annual marketing budget split across five channels, shown as a half donut.
View template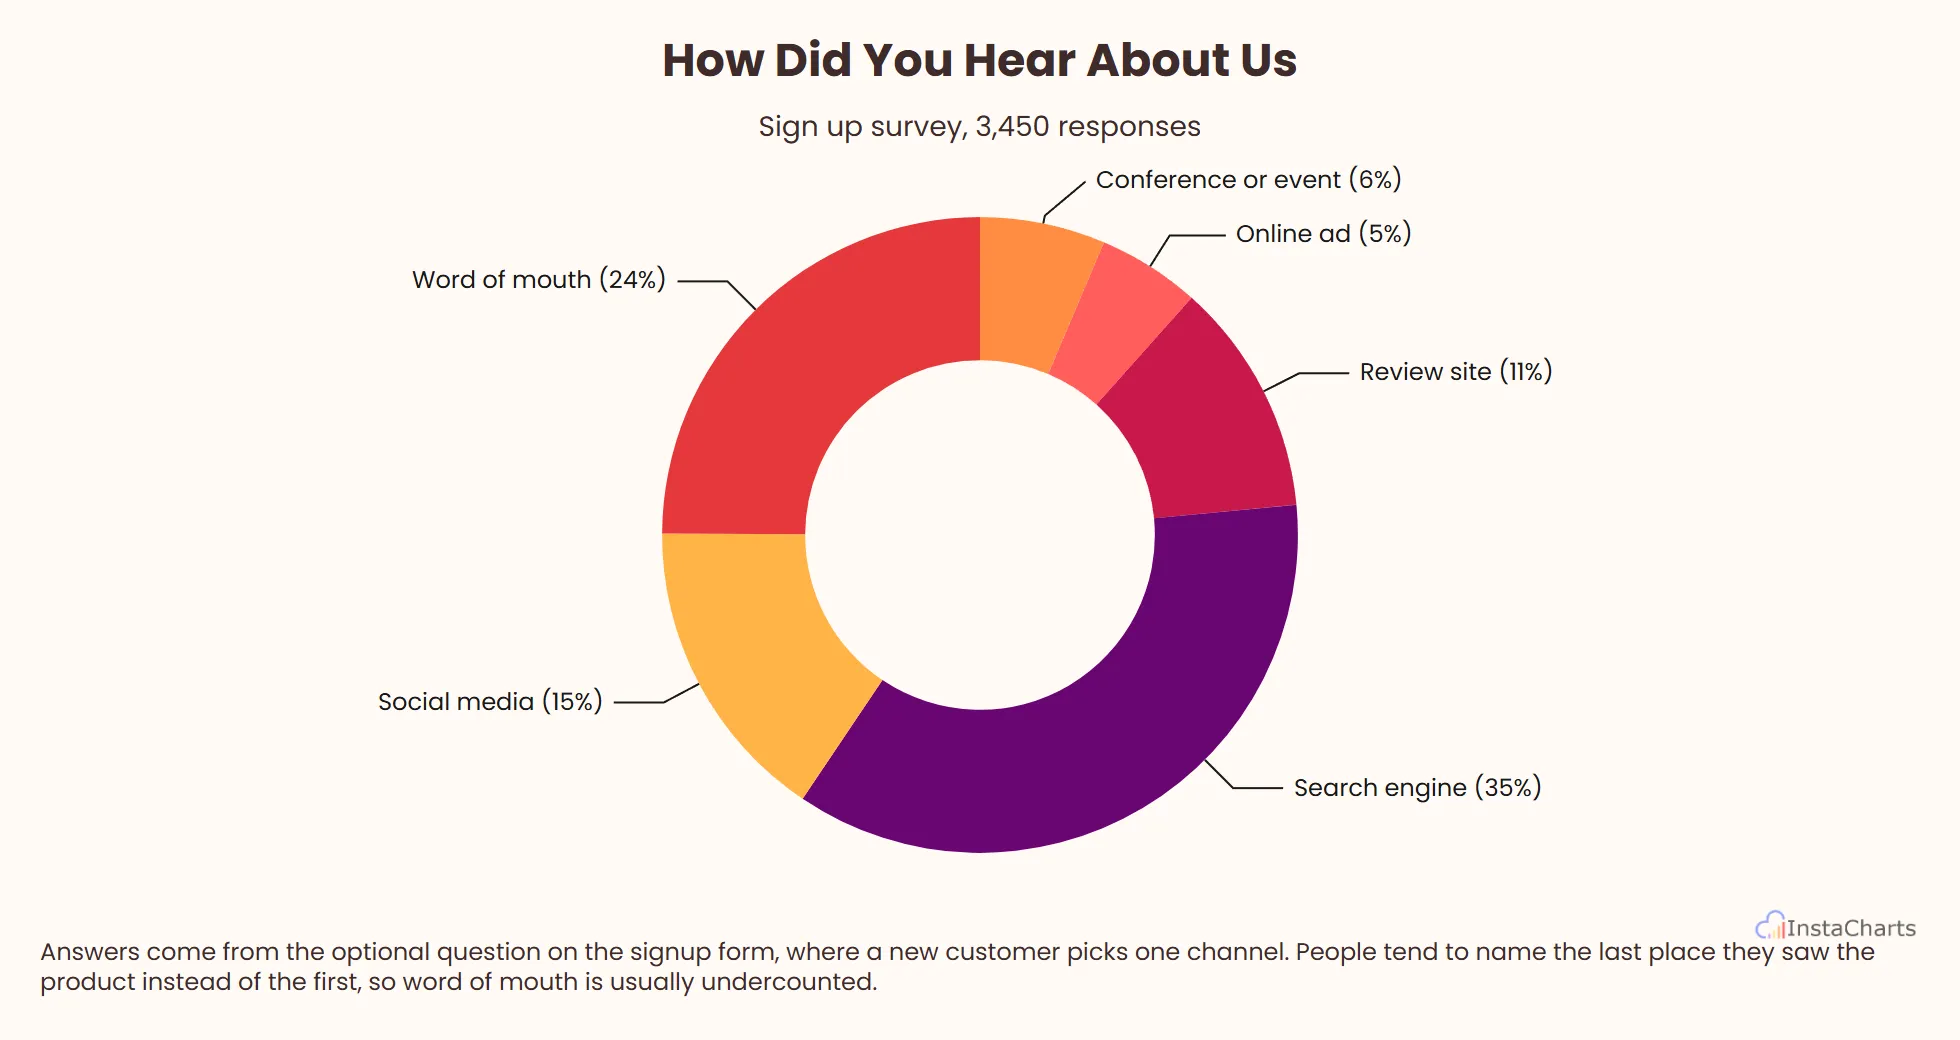 Donut Chart
How Did You Hear About Us
Sign up survey answers naming where each new customer first found the product, shown as a donut.
View templateSales Chart Templates
Sales reviews come back to the same questions: how much is in the pipeline, who is closing, and how close the team is to quota. These templates answer each one with a chart that is ready for a forecast call or a board slide.
 Horizontal Bar Chart
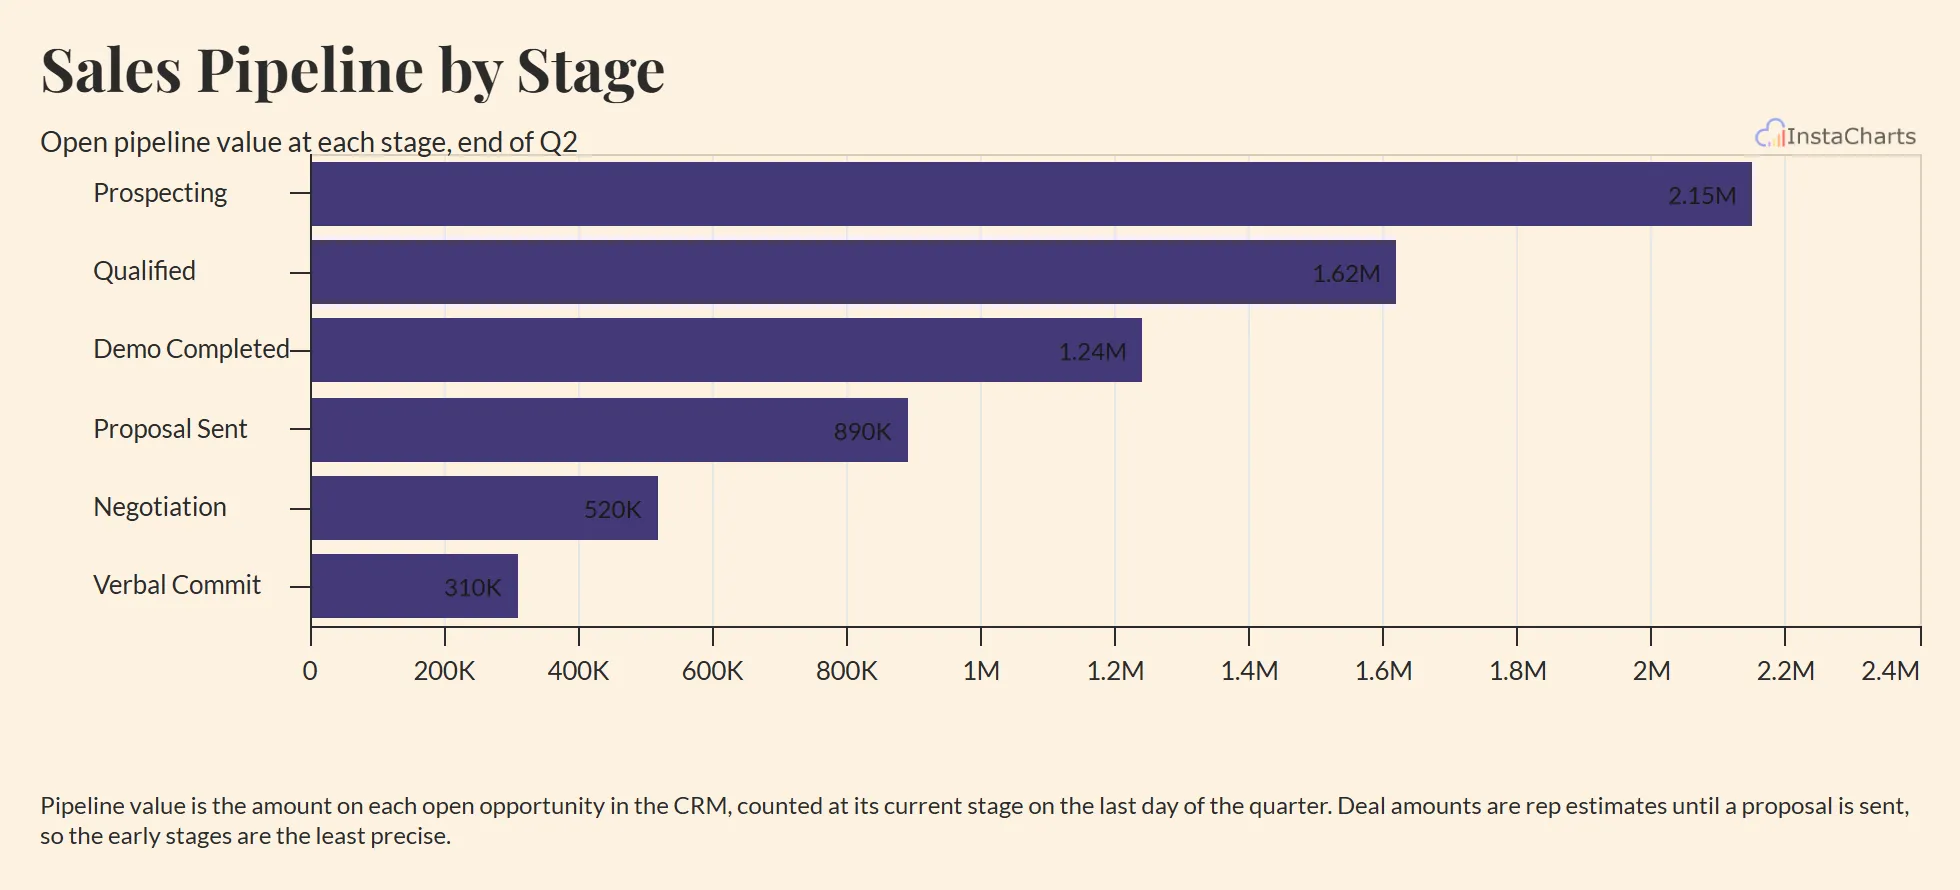
Sales Pipeline by Stage
Open pipeline value at each deal stage, from first contact to verbal commit, drawn as horizontal bars in stage order.
View template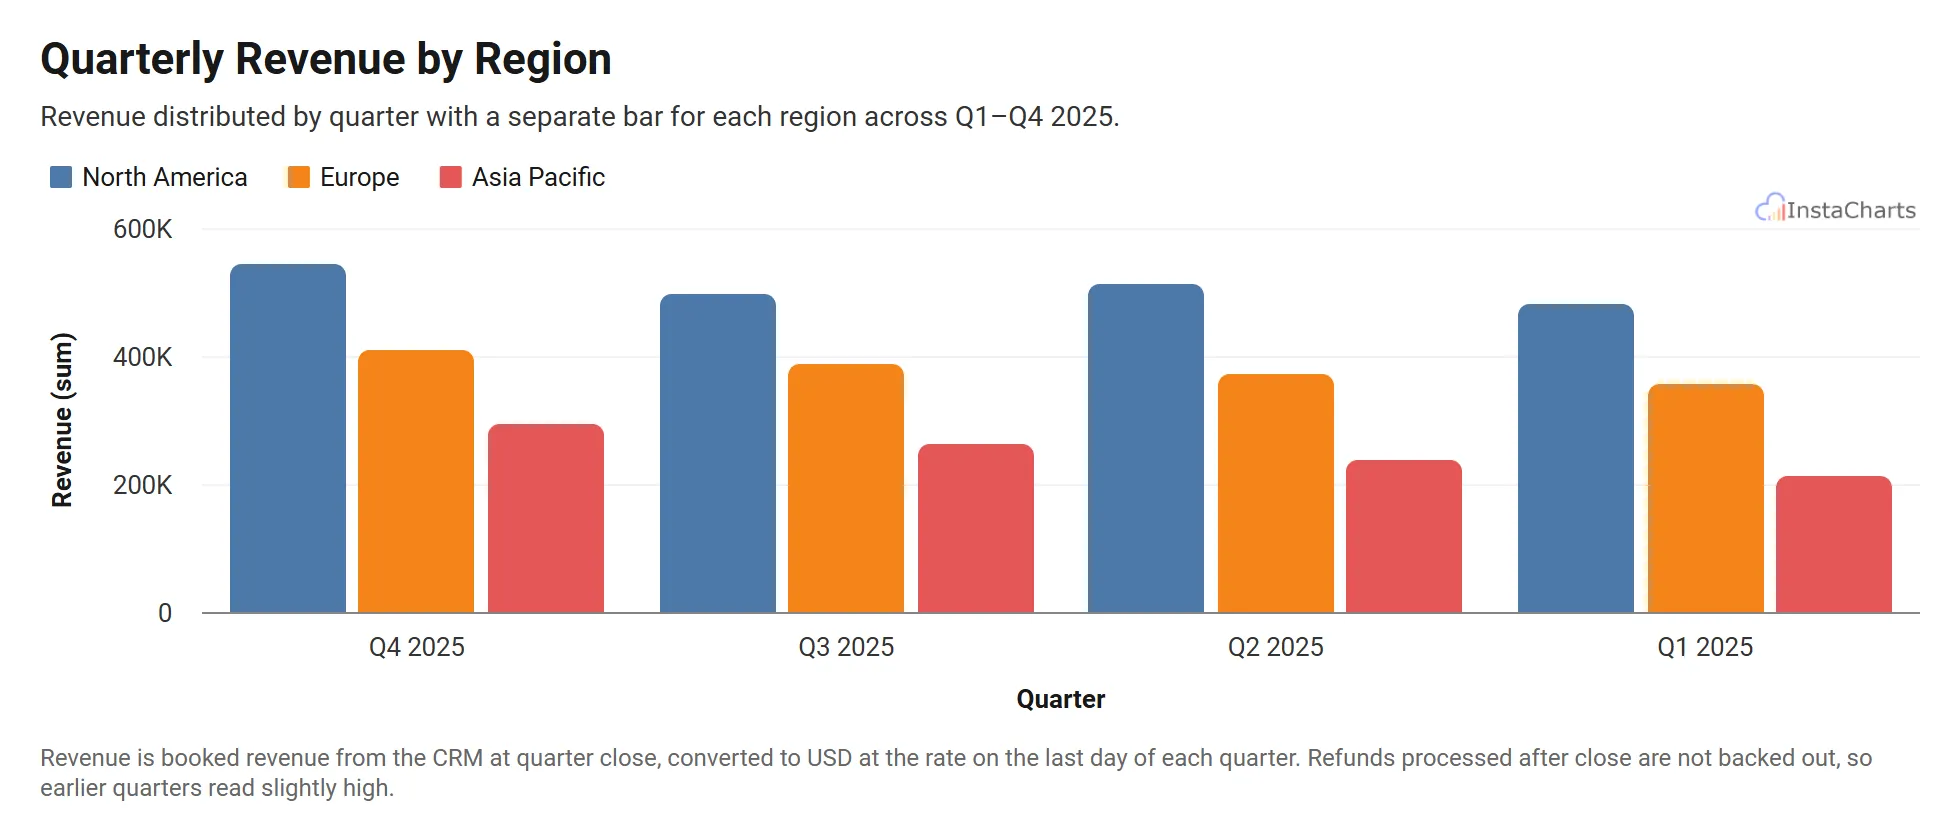 Grouped Bar Chart
Quarterly Revenue by Region
Revenue across North America, Europe and Asia Pacific for four quarters.
View template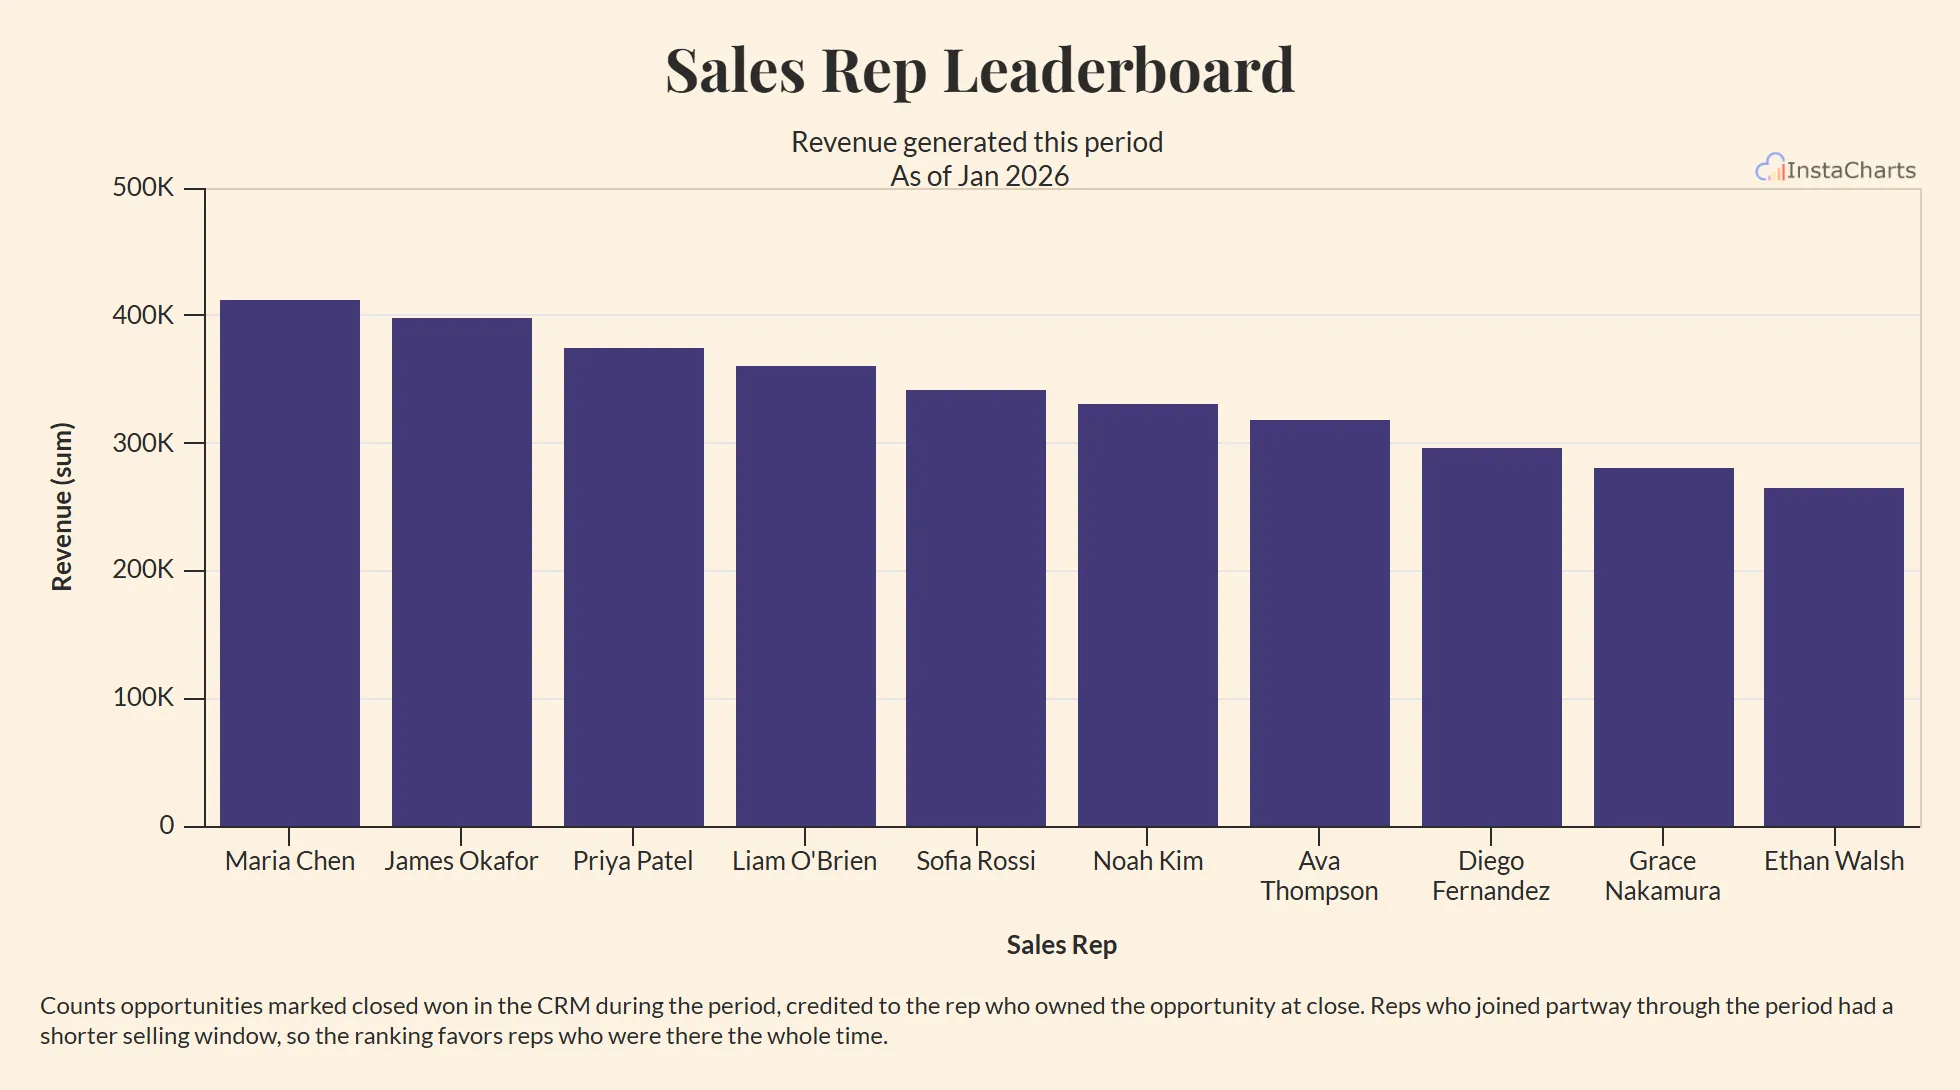 Bar Chart
Sales Rep Leaderboard
Deals closed and revenue generated by each sales representative on the team.
View template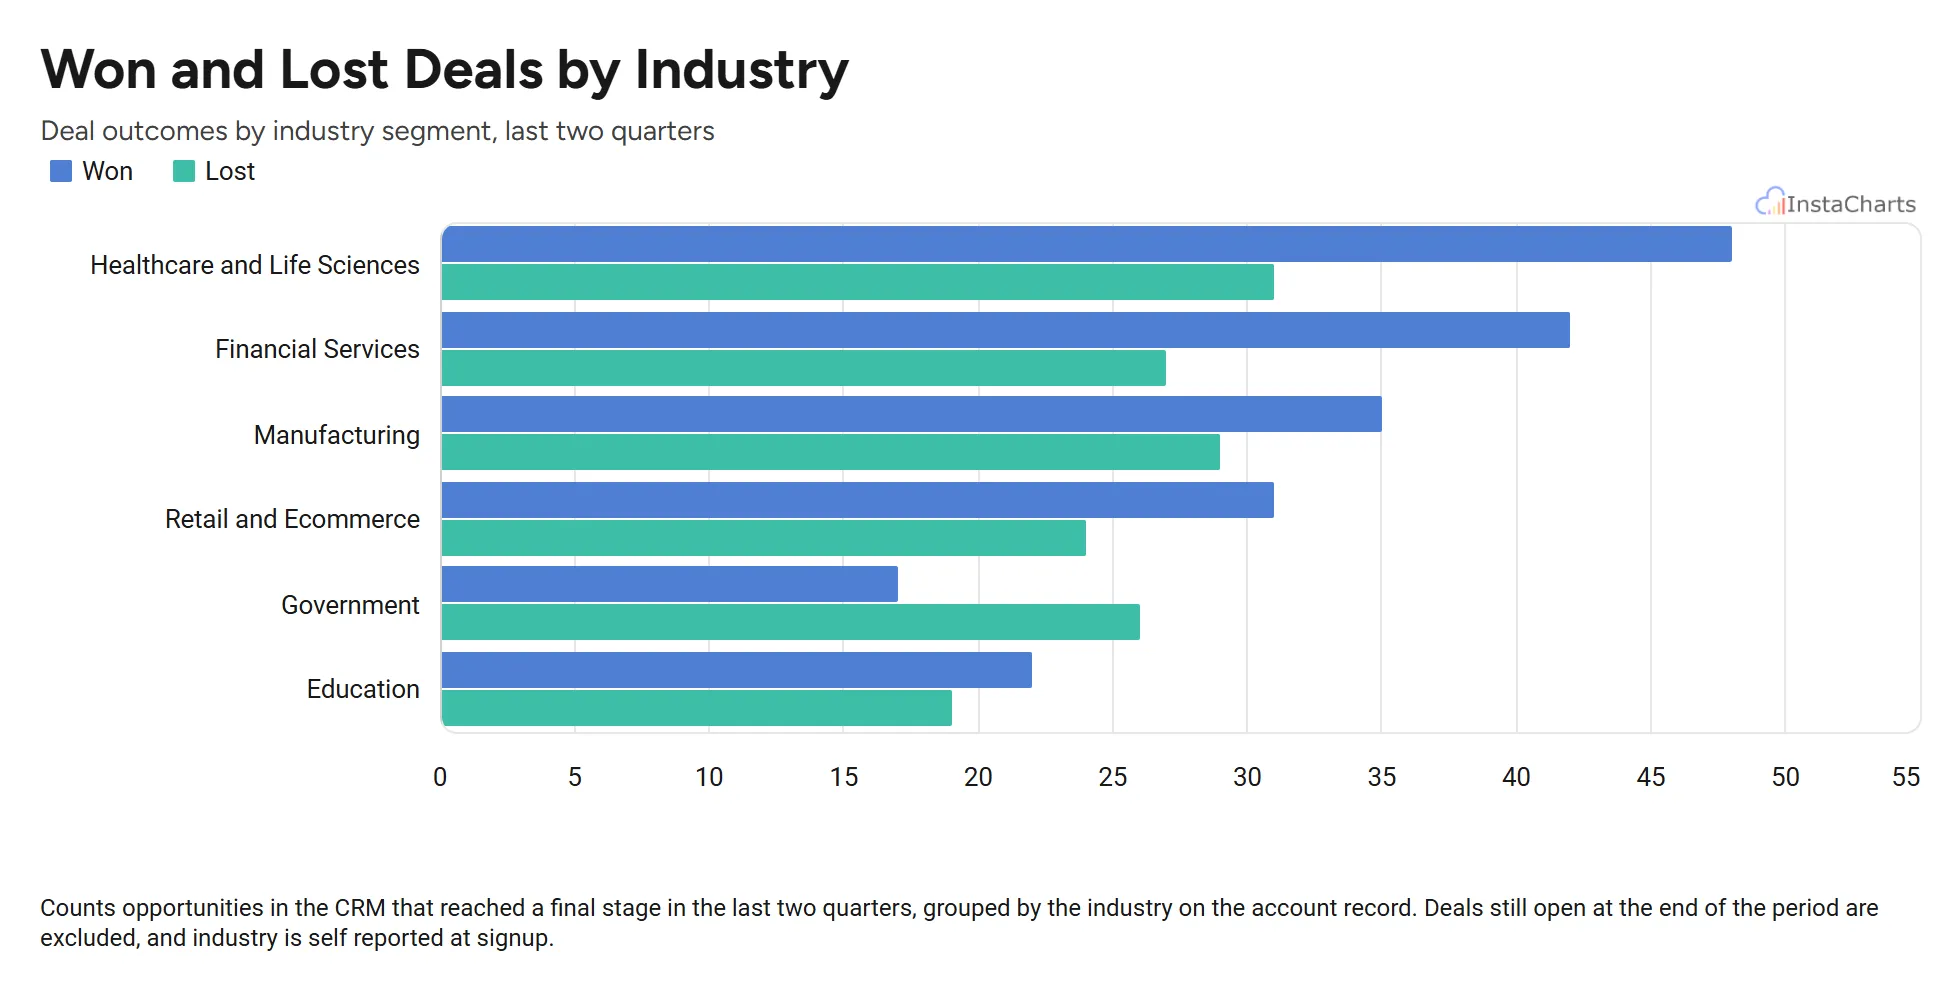 Horizontal Grouped Bar Chart
Won and Lost Deals by Industry
Deals won and deals lost in each industry segment, drawn as horizontal bars so the industry names stay readable.
View template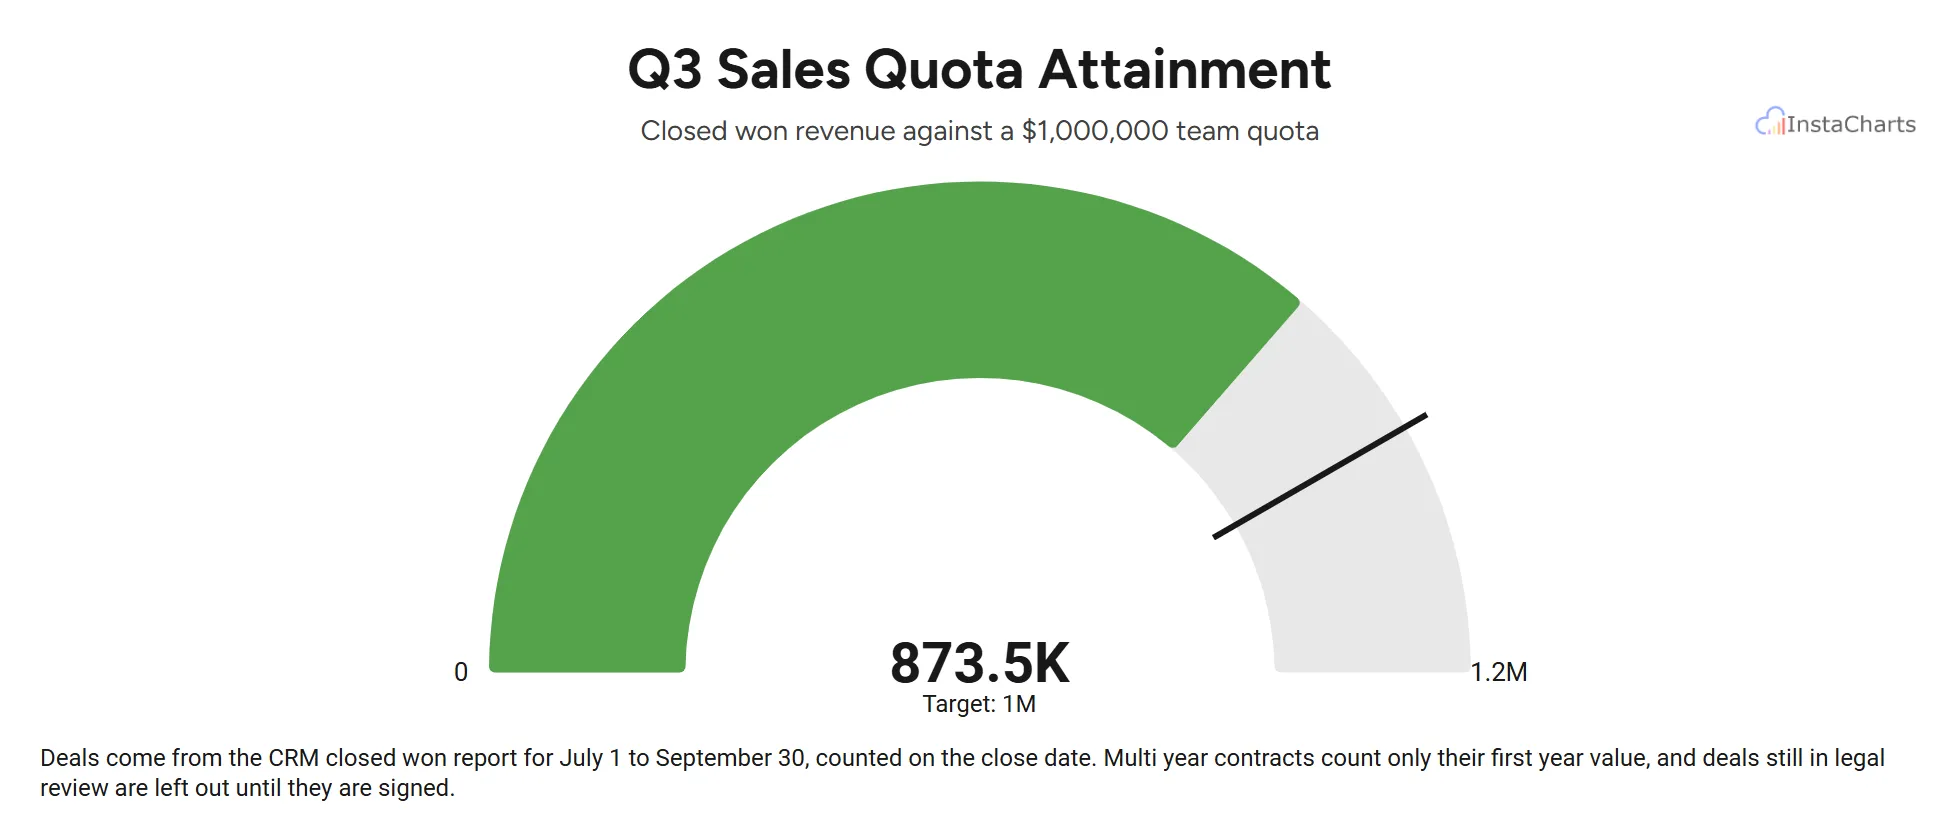 Gauge Chart
Quarterly Sales Goal
Closed won deals for one sales team over a quarter, added up and shown on a gauge against the team quota.
View template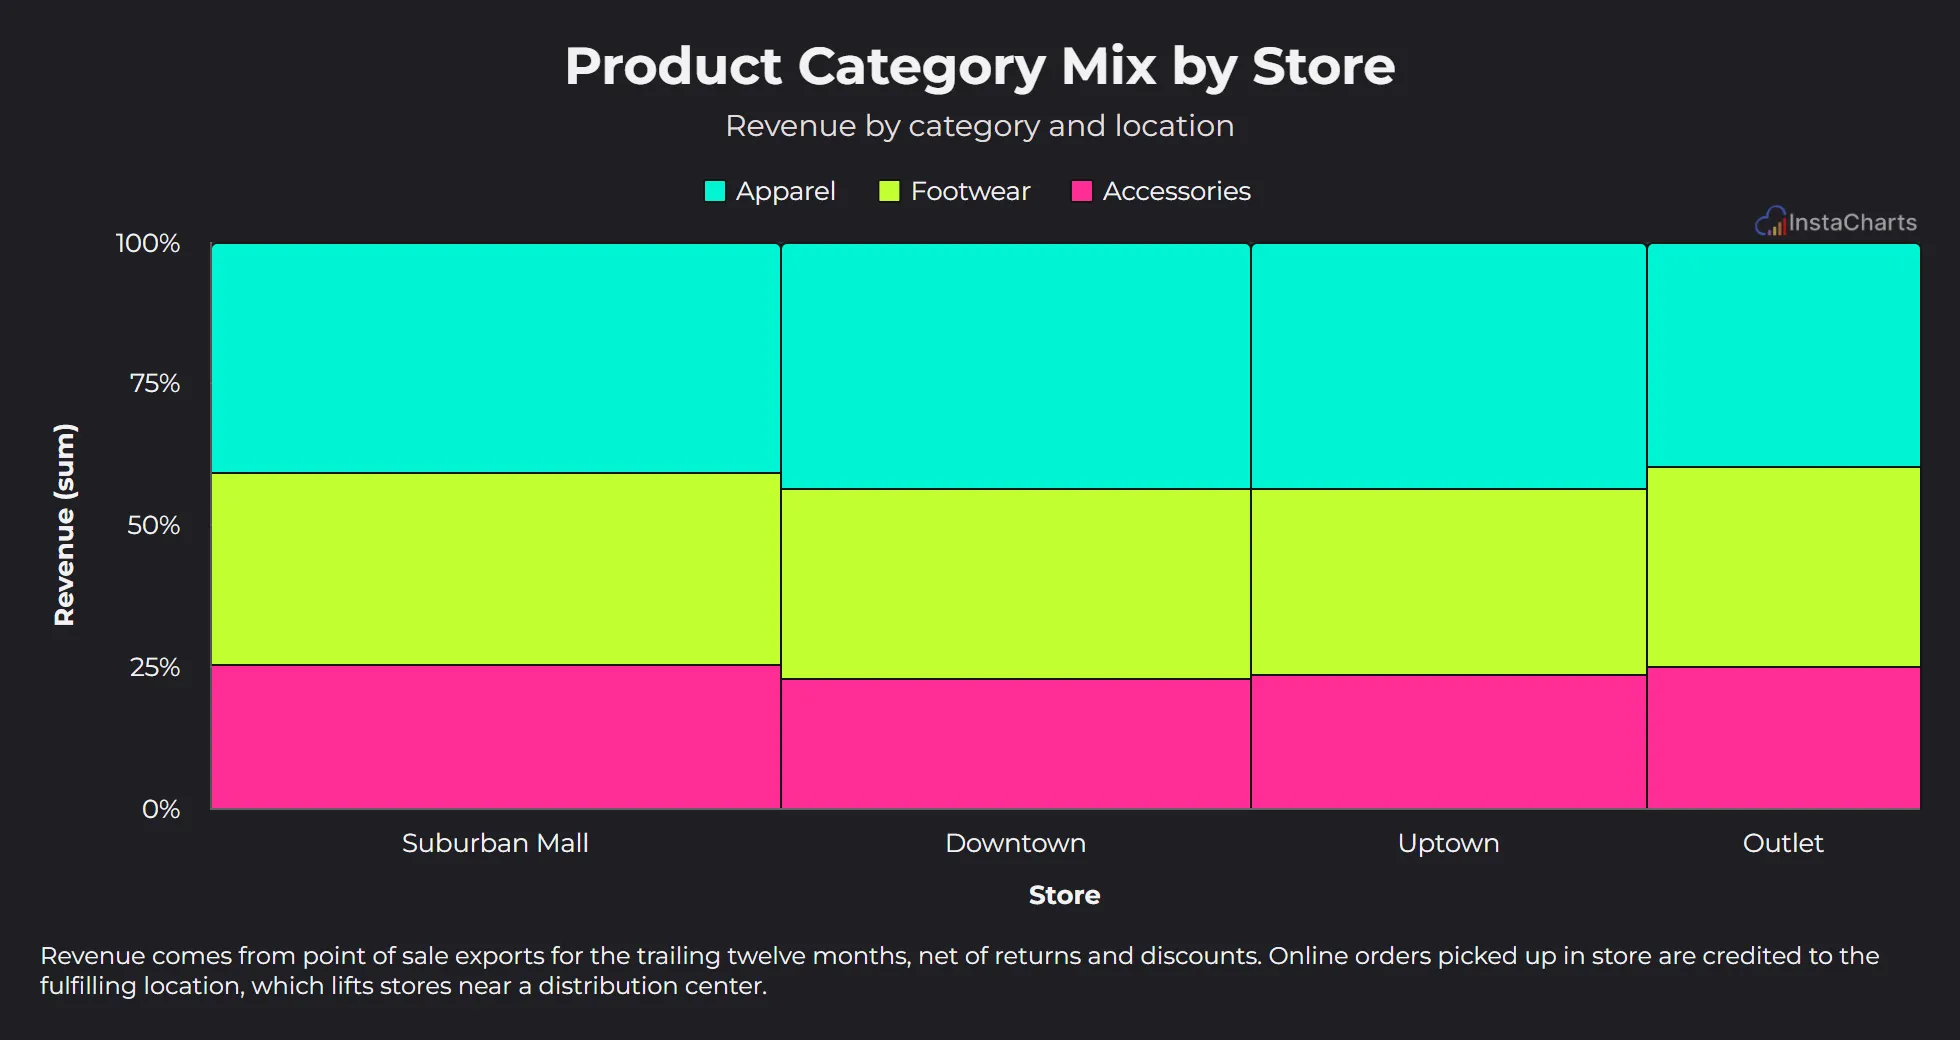 Mekko Chart
Product Category Mix by Store
Revenue by product category for each retail store location.
View templateFinance Chart Templates
Finance charts need to be exact and easy to read in a board deck or month end report. These templates cover budgets, expenses, cash flow and price trends, with sample figures laid out the way an accounting export usually arrives.
 Grouped Area Chart
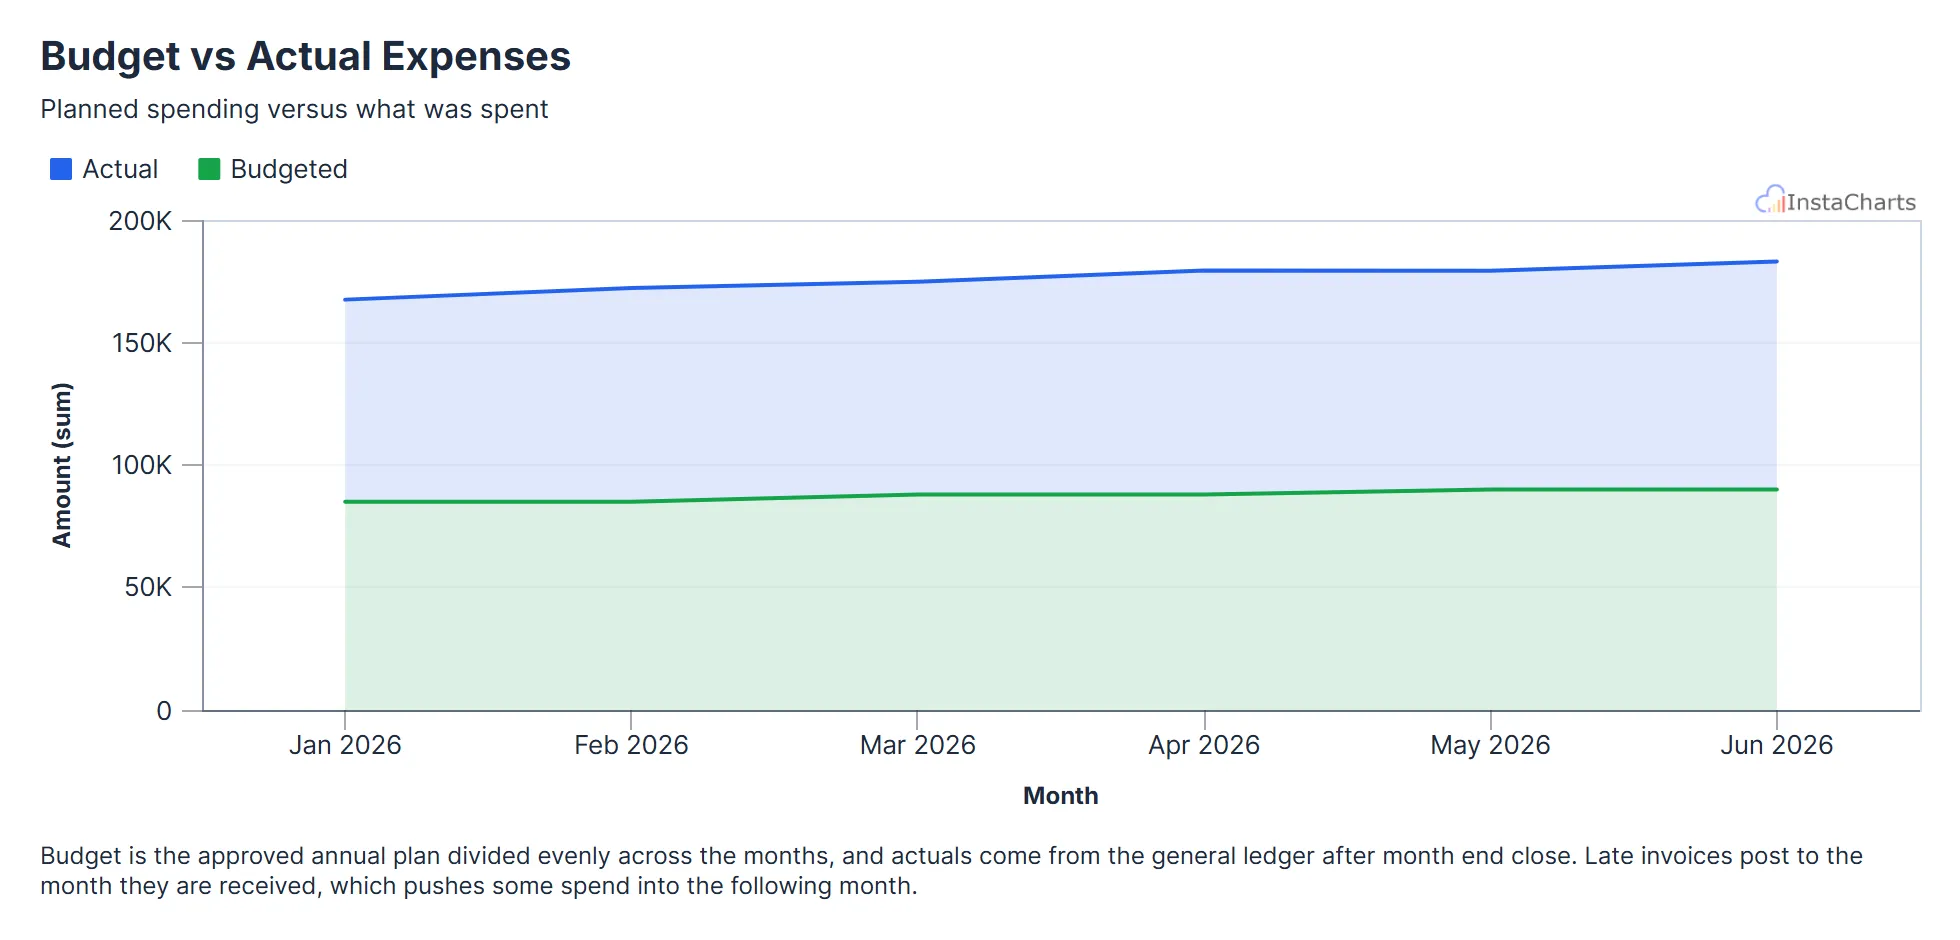
Budget vs Actual Expenses
Budgeted and actual expenses by month, useful for tracking spending against a plan.
View template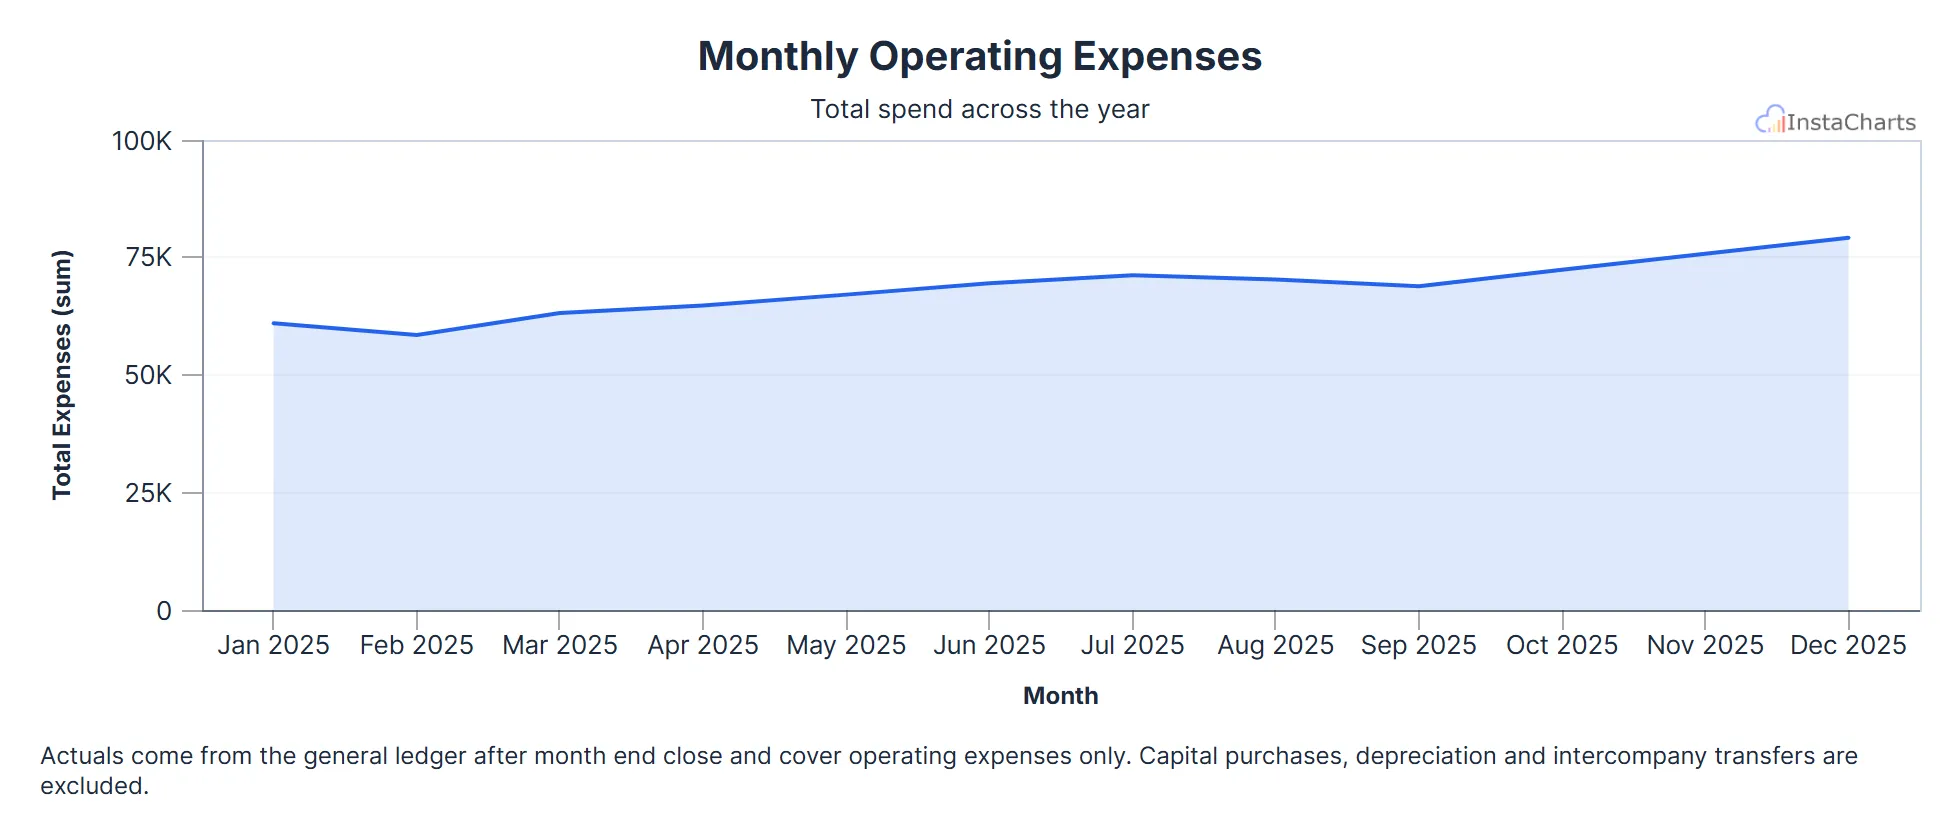 Area Chart
Monthly Operating Expenses
Total operating expenses for each month over a full year.
View template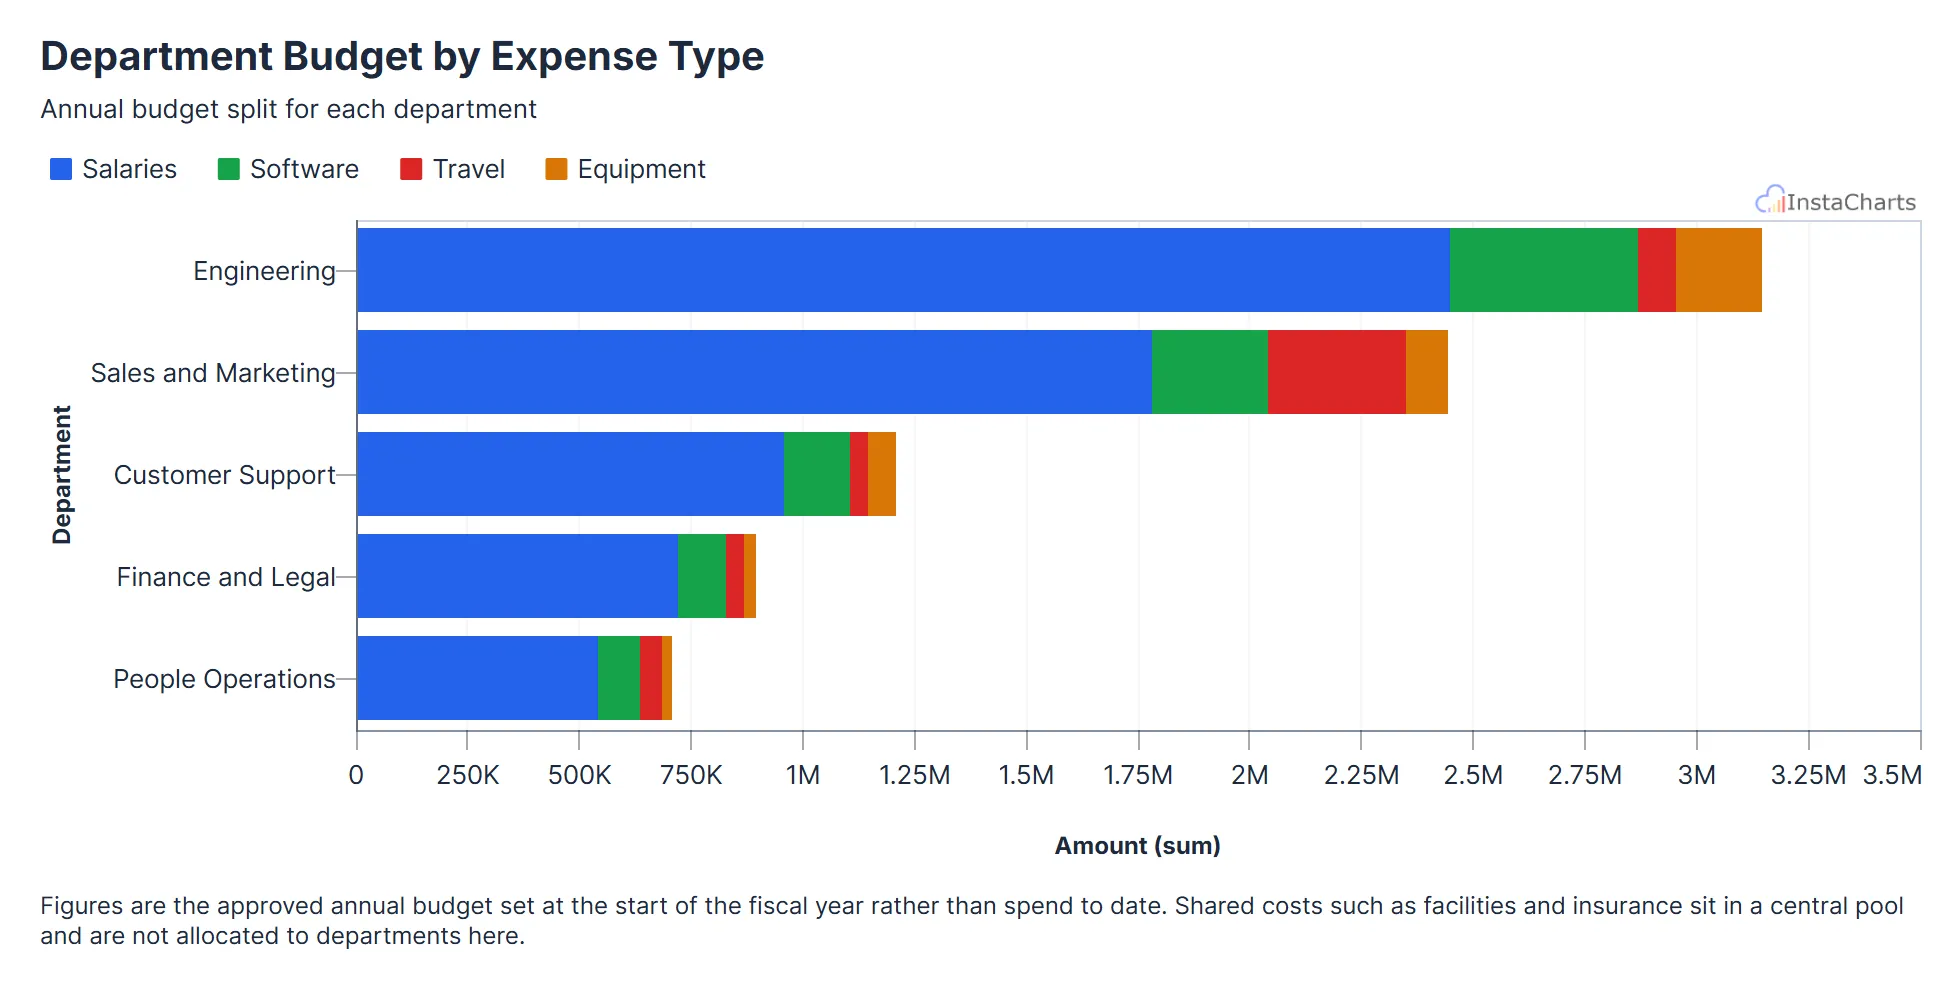 Horizontal Stacked Bar Chart
Department Budget by Expense Type
How each department's annual budget splits across salaries, software, travel and equipment, stacked into horizontal bars.
View template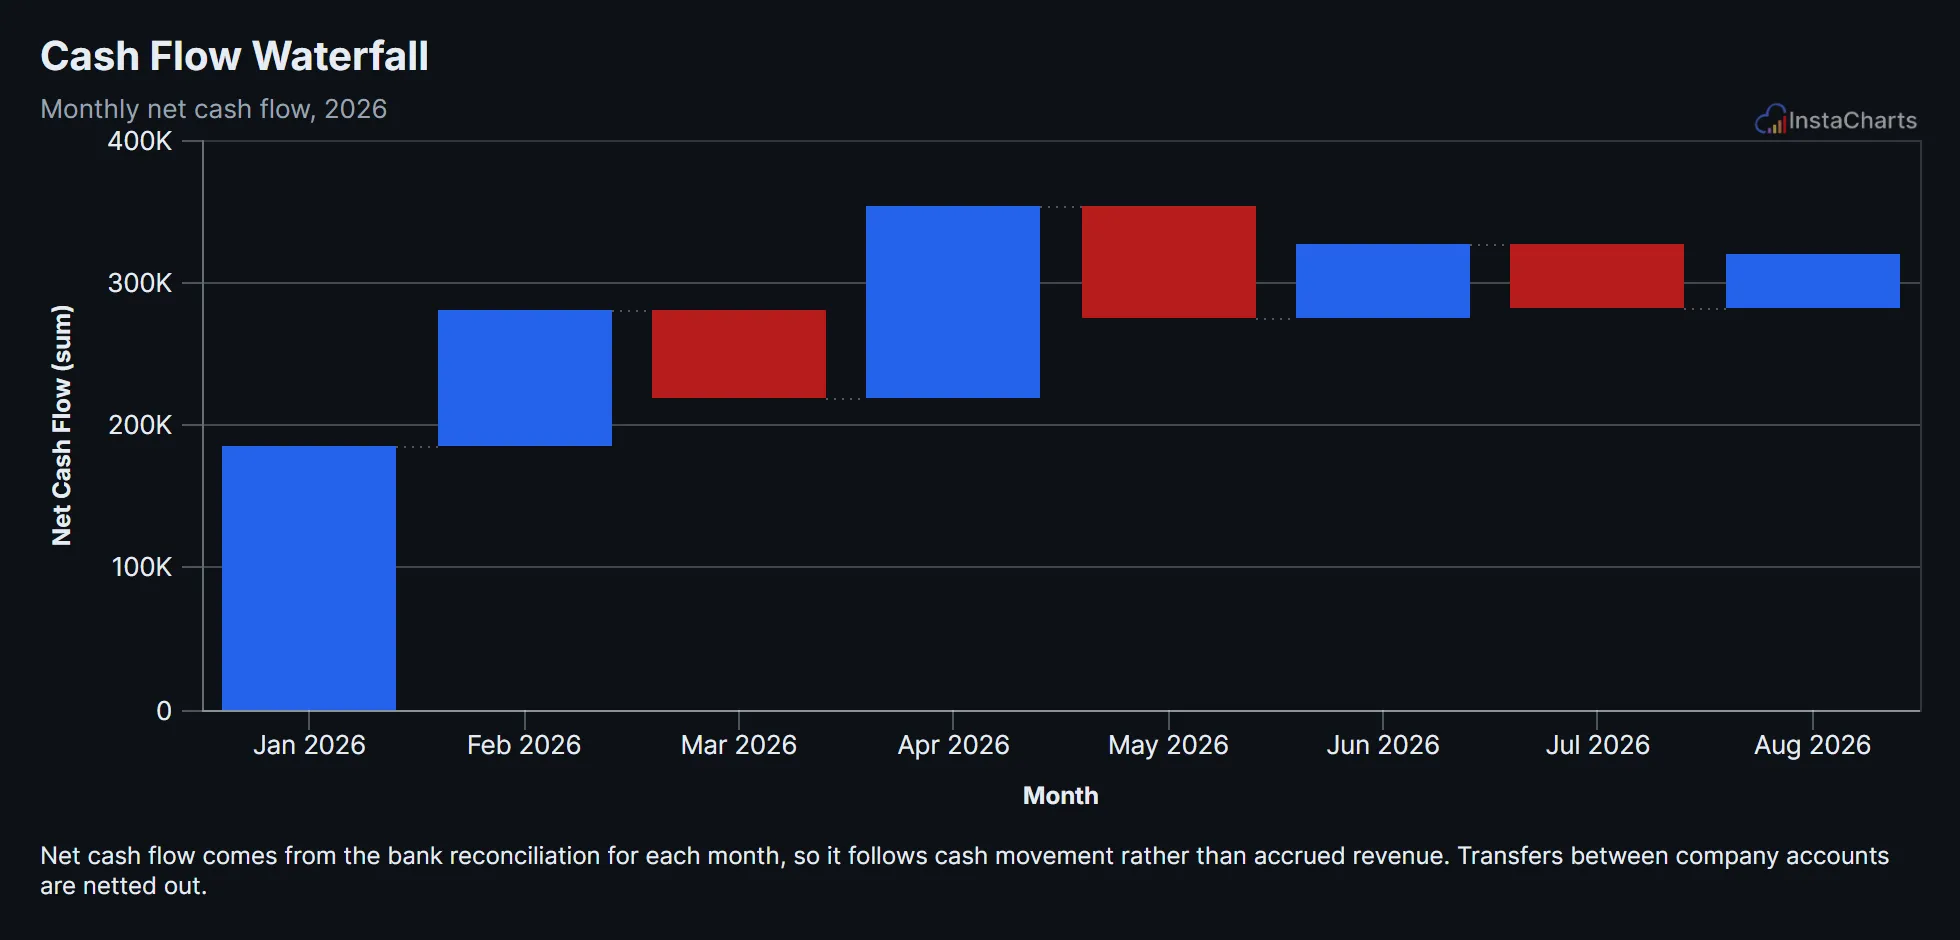 Waterfall Chart
Cash Flow Waterfall
Net cash flow for each month of the year, shown as a waterfall of rises and drops building toward the ending balance.
View template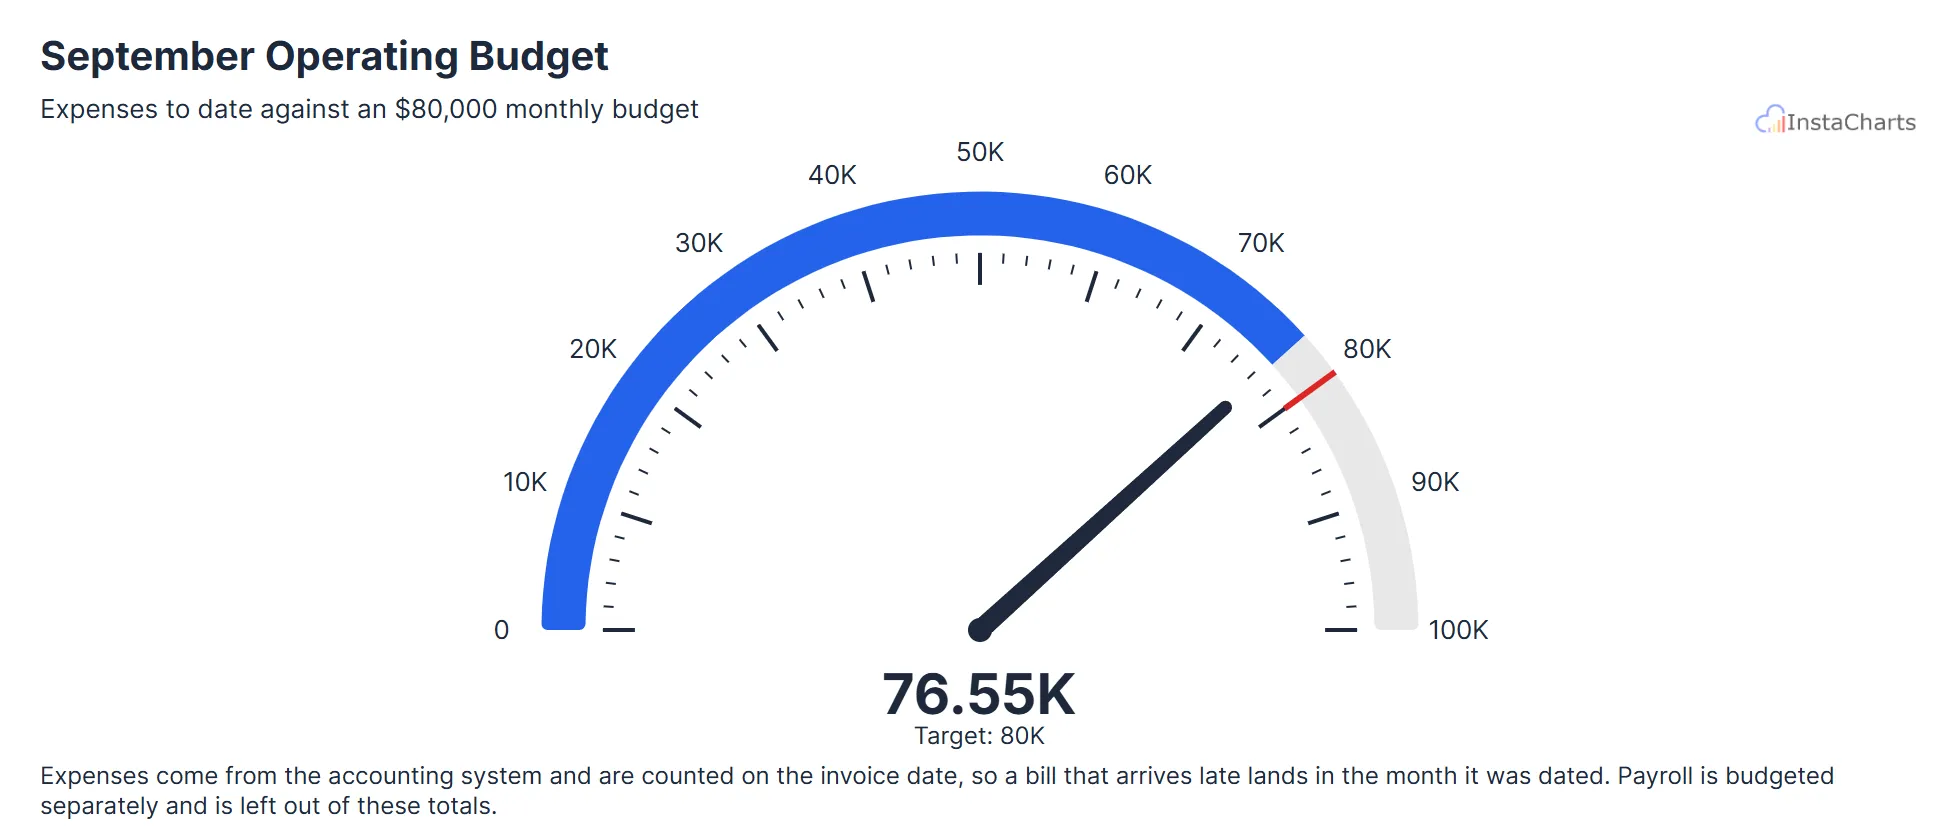 Needle Gauge Chart
Monthly Operating Budget Spent
One month of operating expenses added up and shown on a needle gauge, with the monthly budget marked as the target.
View template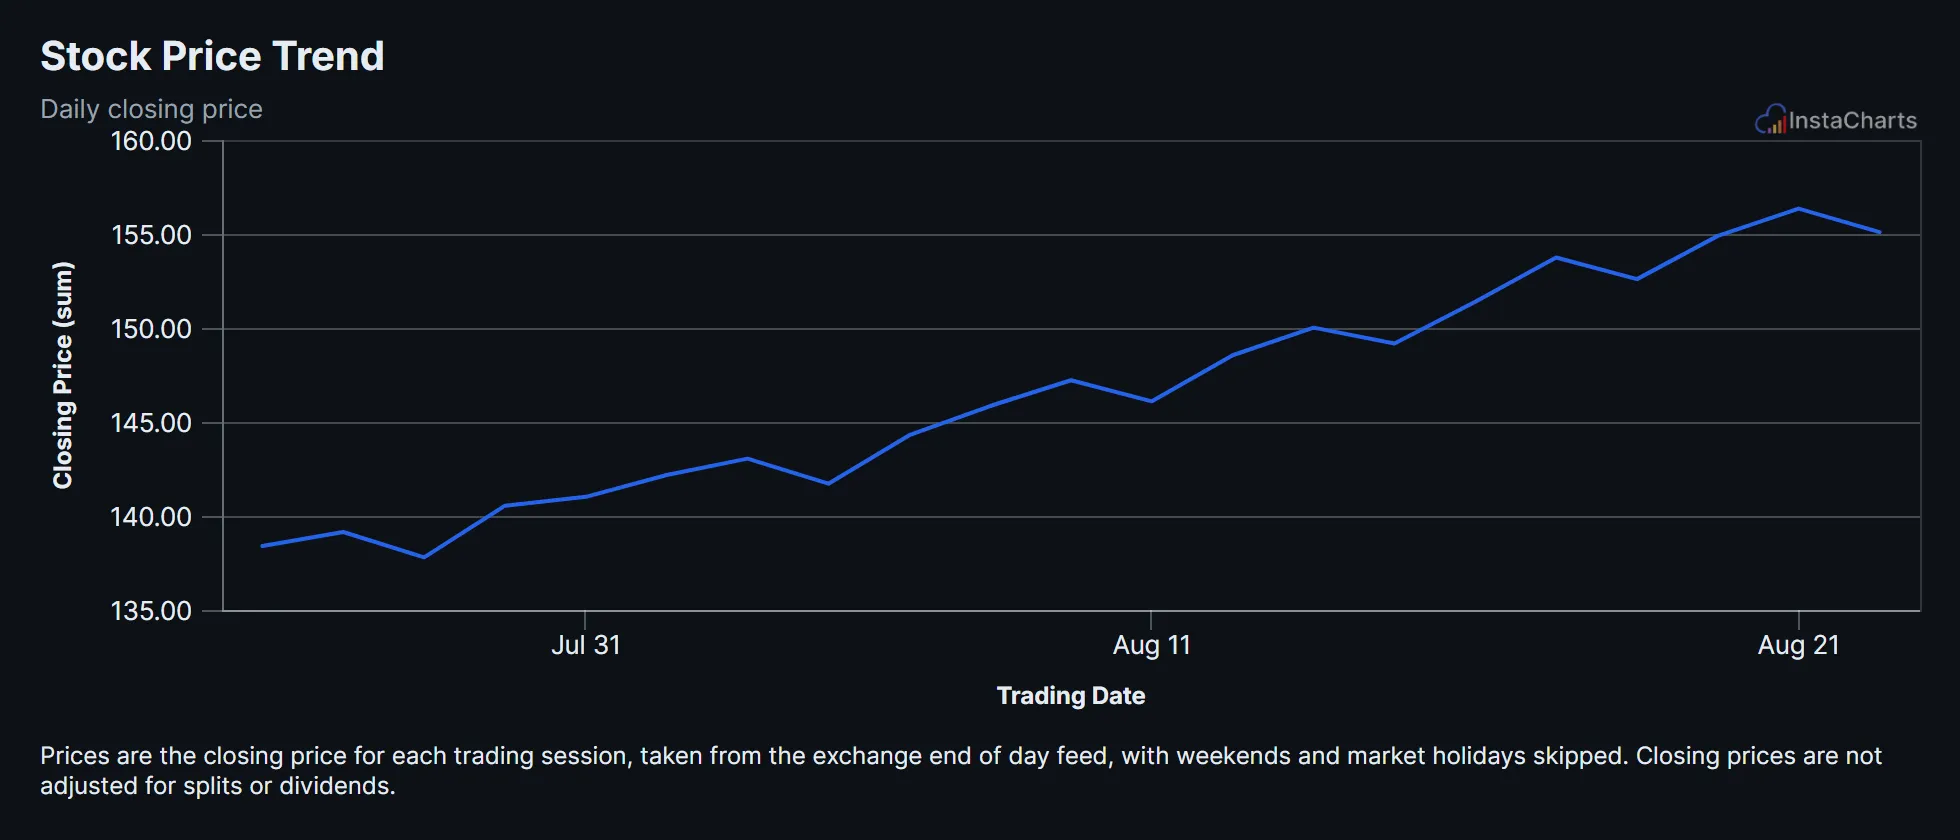 Line Chart
Stock Price Trend
Daily closing price for a sample stock ticker over several weeks of trading.
View templateHR Chart Templates
People teams track turnover, engagement and satisfaction across departments. These templates turn HR system exports and survey results into charts that leadership can read at a glance.
 Grouped Line Chart
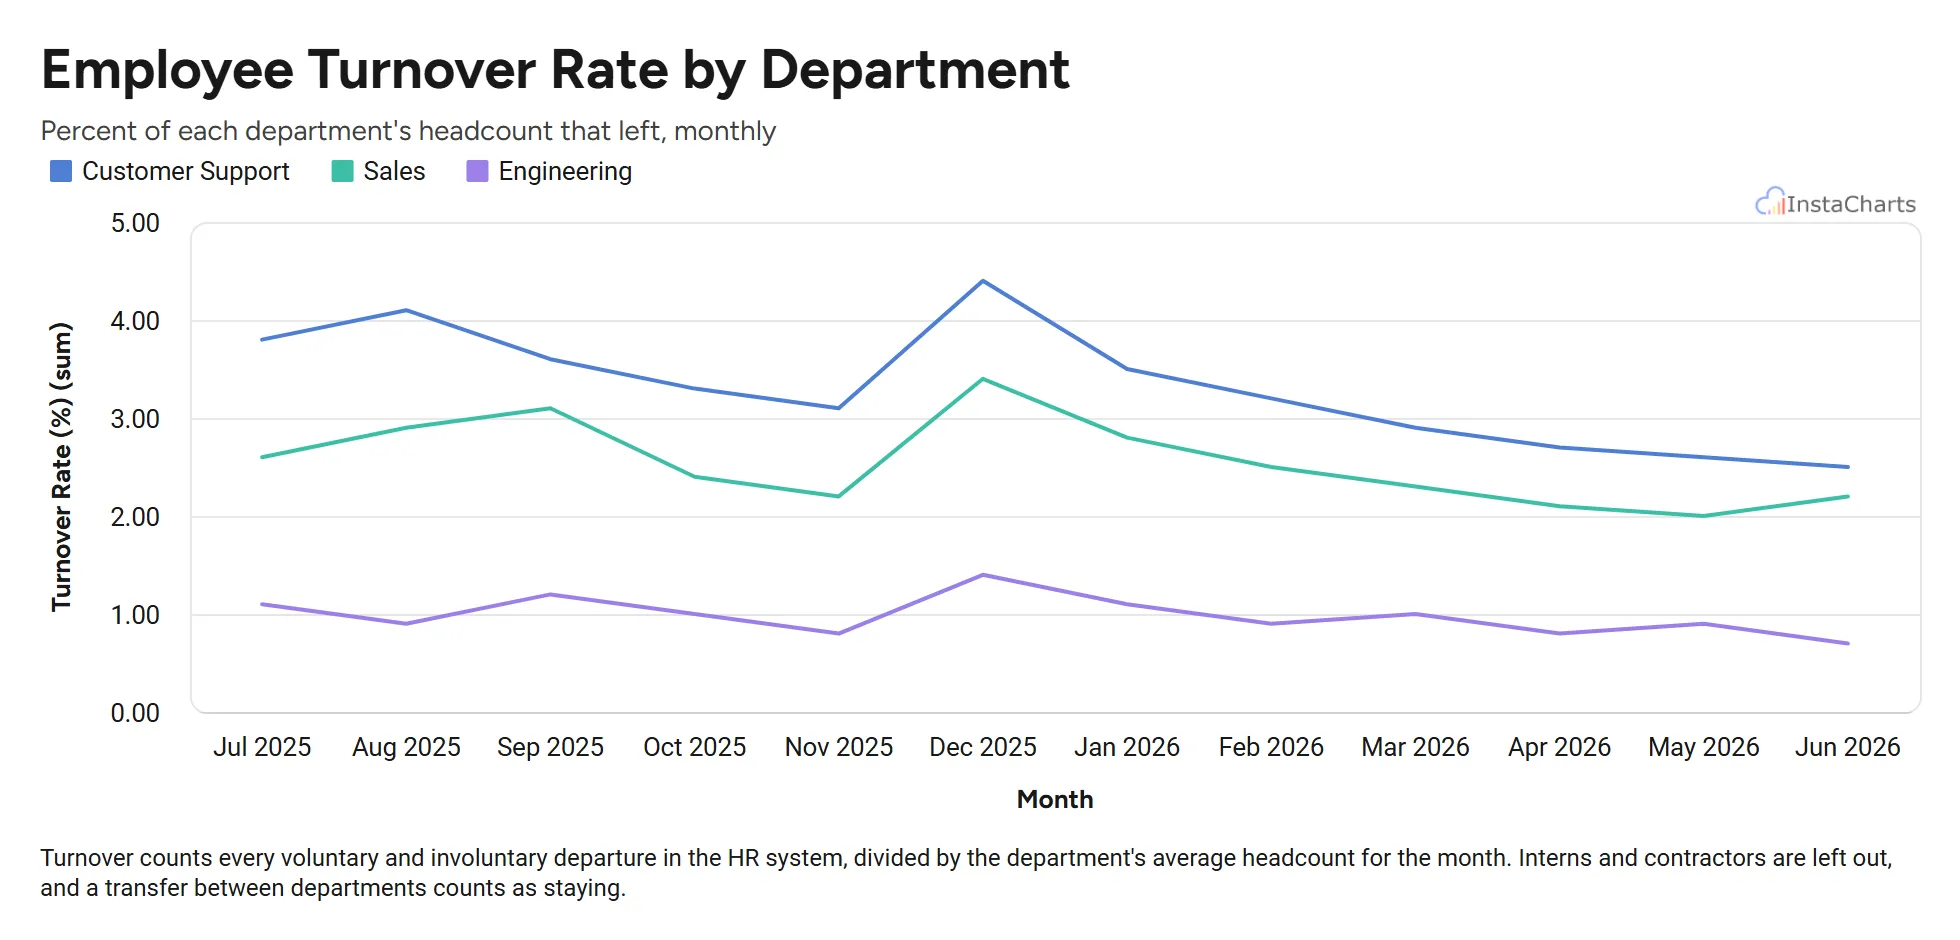
Employee Turnover by Department
Monthly employee turnover rate for sales, engineering and customer support over twelve months.
View template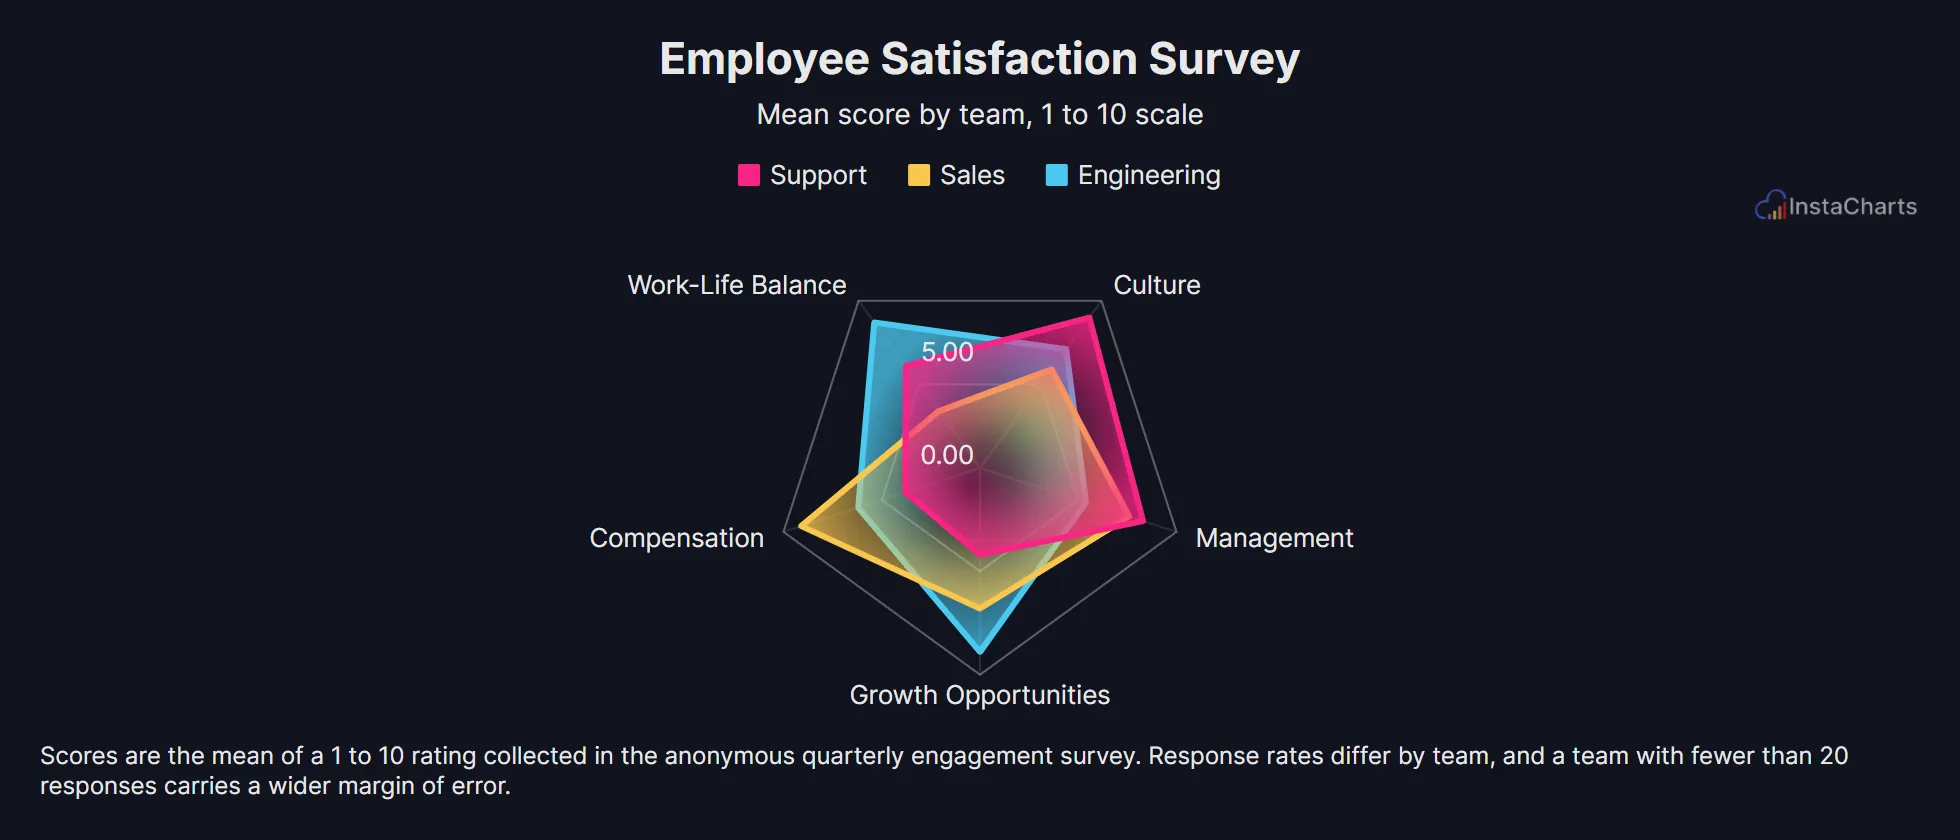 Radar Chart
Employee Satisfaction Survey
Survey scores across compensation, work-life balance, management, growth and culture for three teams.
View template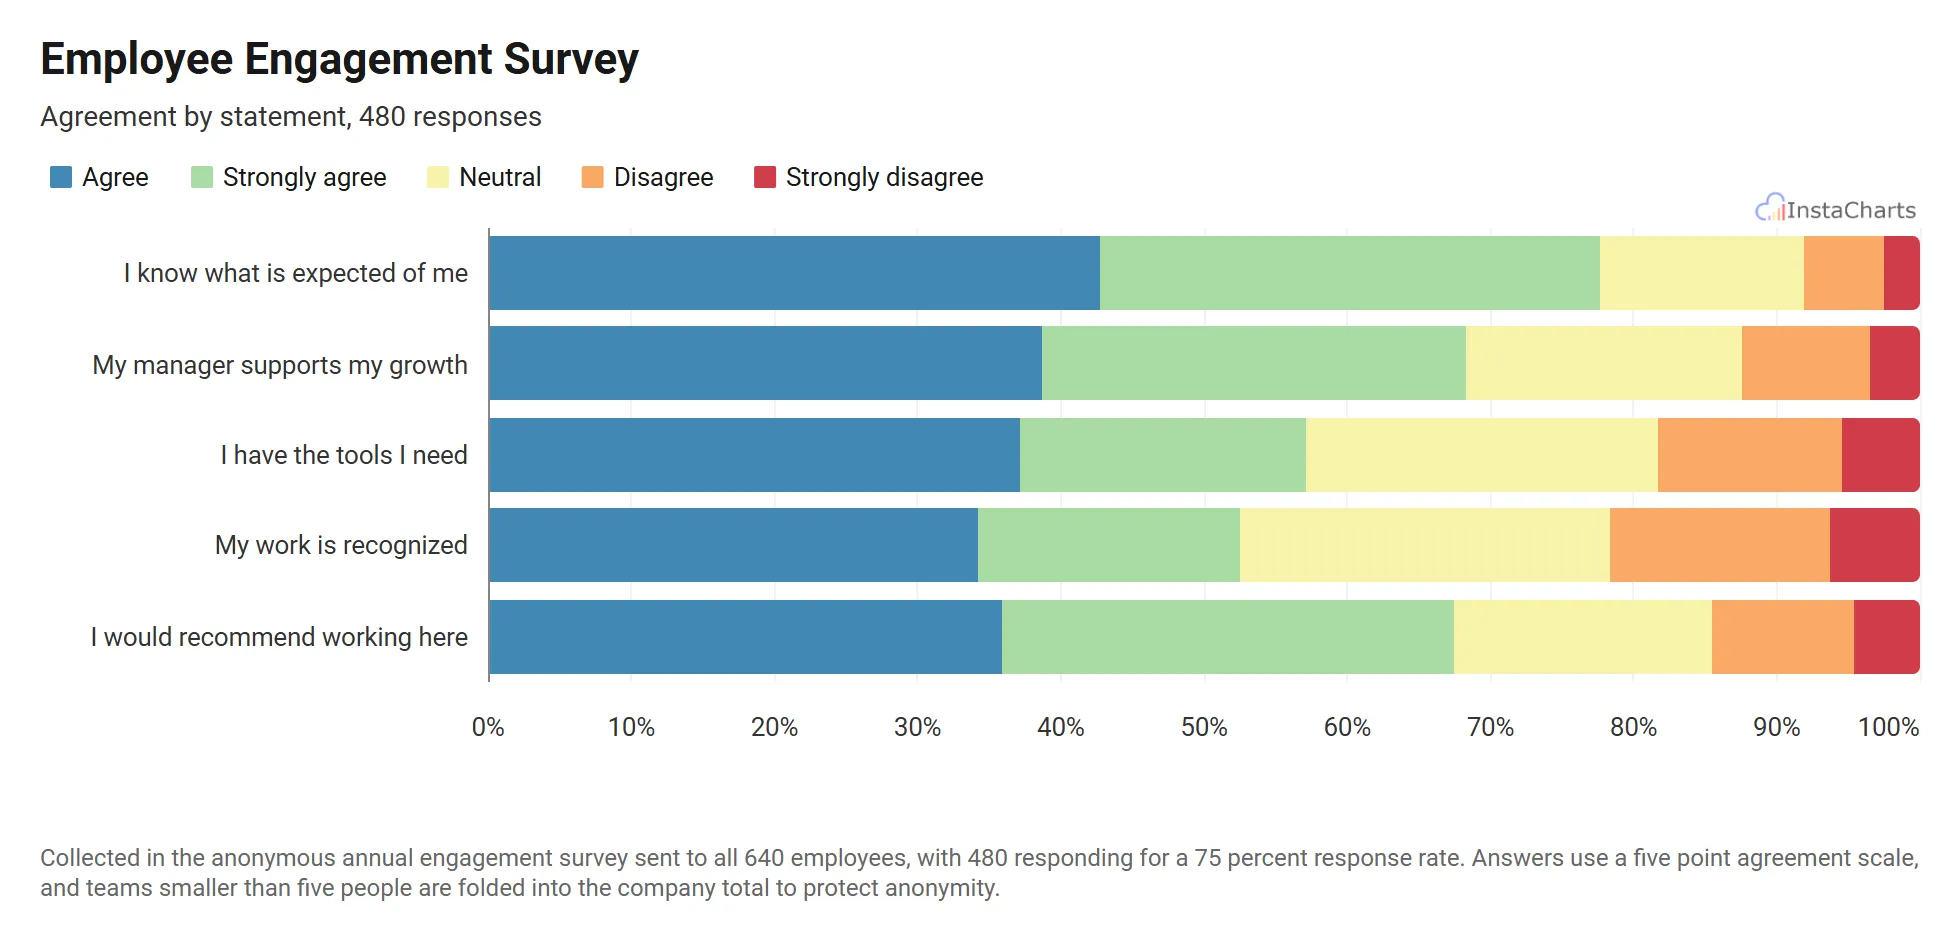 100% Stacked Bar Chart
Employee Engagement Survey
Agreement levels for five engagement statements, stacked into horizontal bars so each question reads as one row.
View templateNonprofit Chart Templates
Nonprofits report to donors, boards and grant makers throughout the year. These templates show where funding comes from, how campaigns are tracking toward their goals and how many hours volunteers put in.
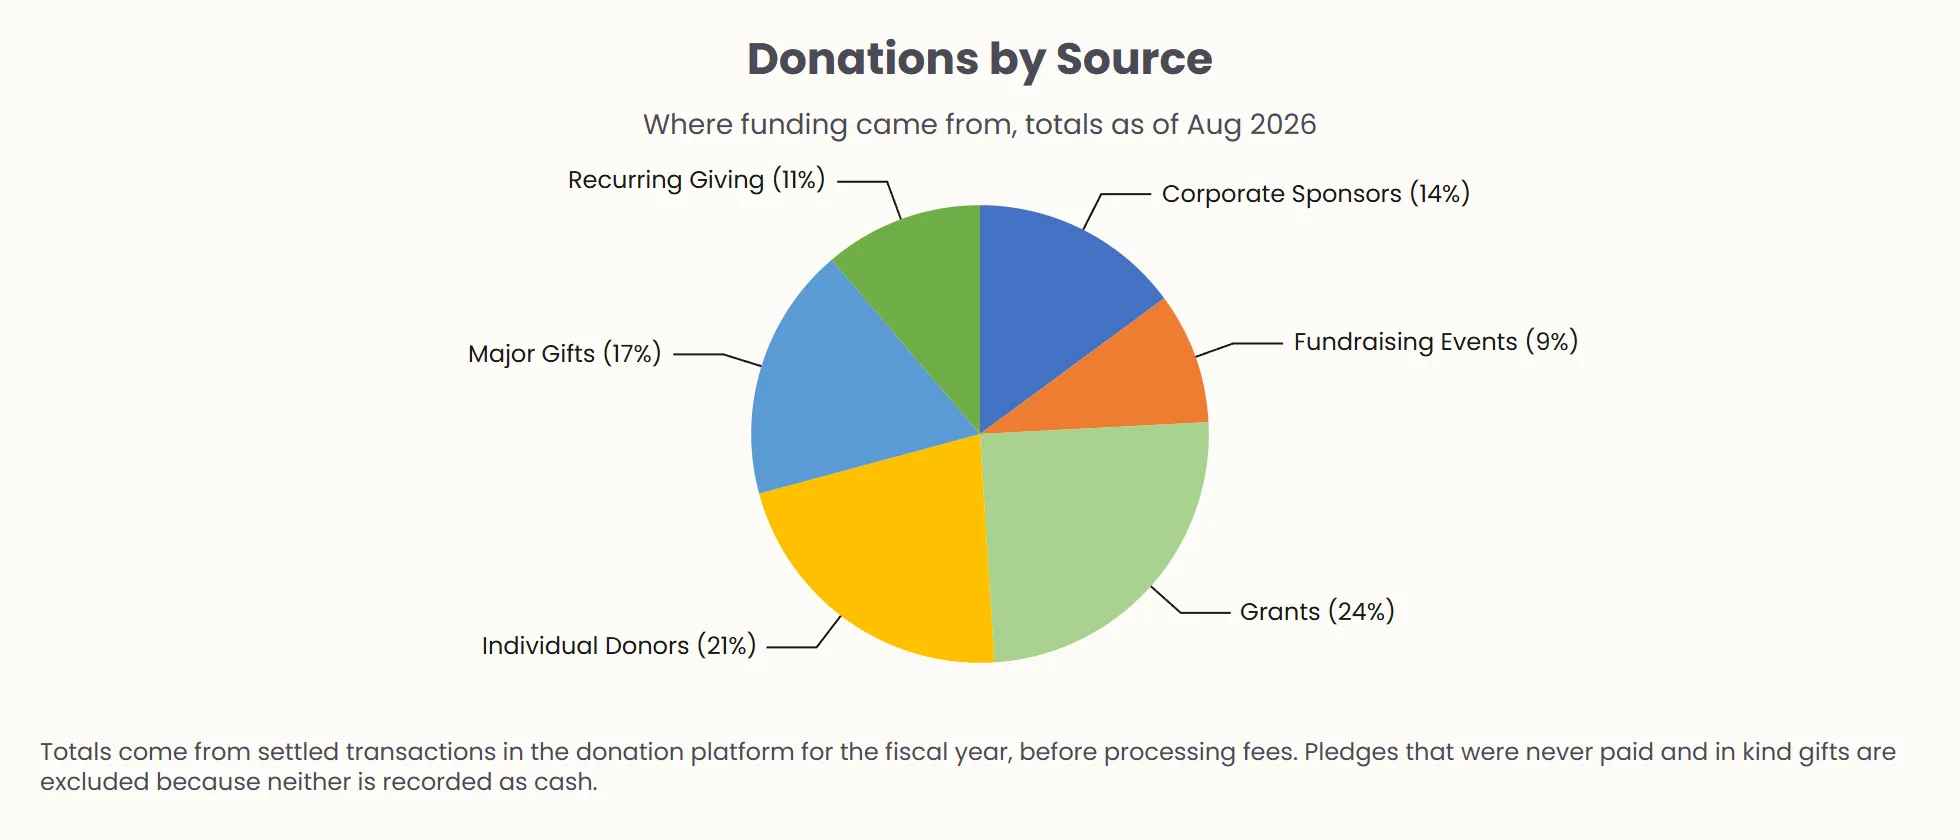 Pie Chart
Donations by Source
Total donations broken down by source, including individual donors, corporate sponsors and grants.
View template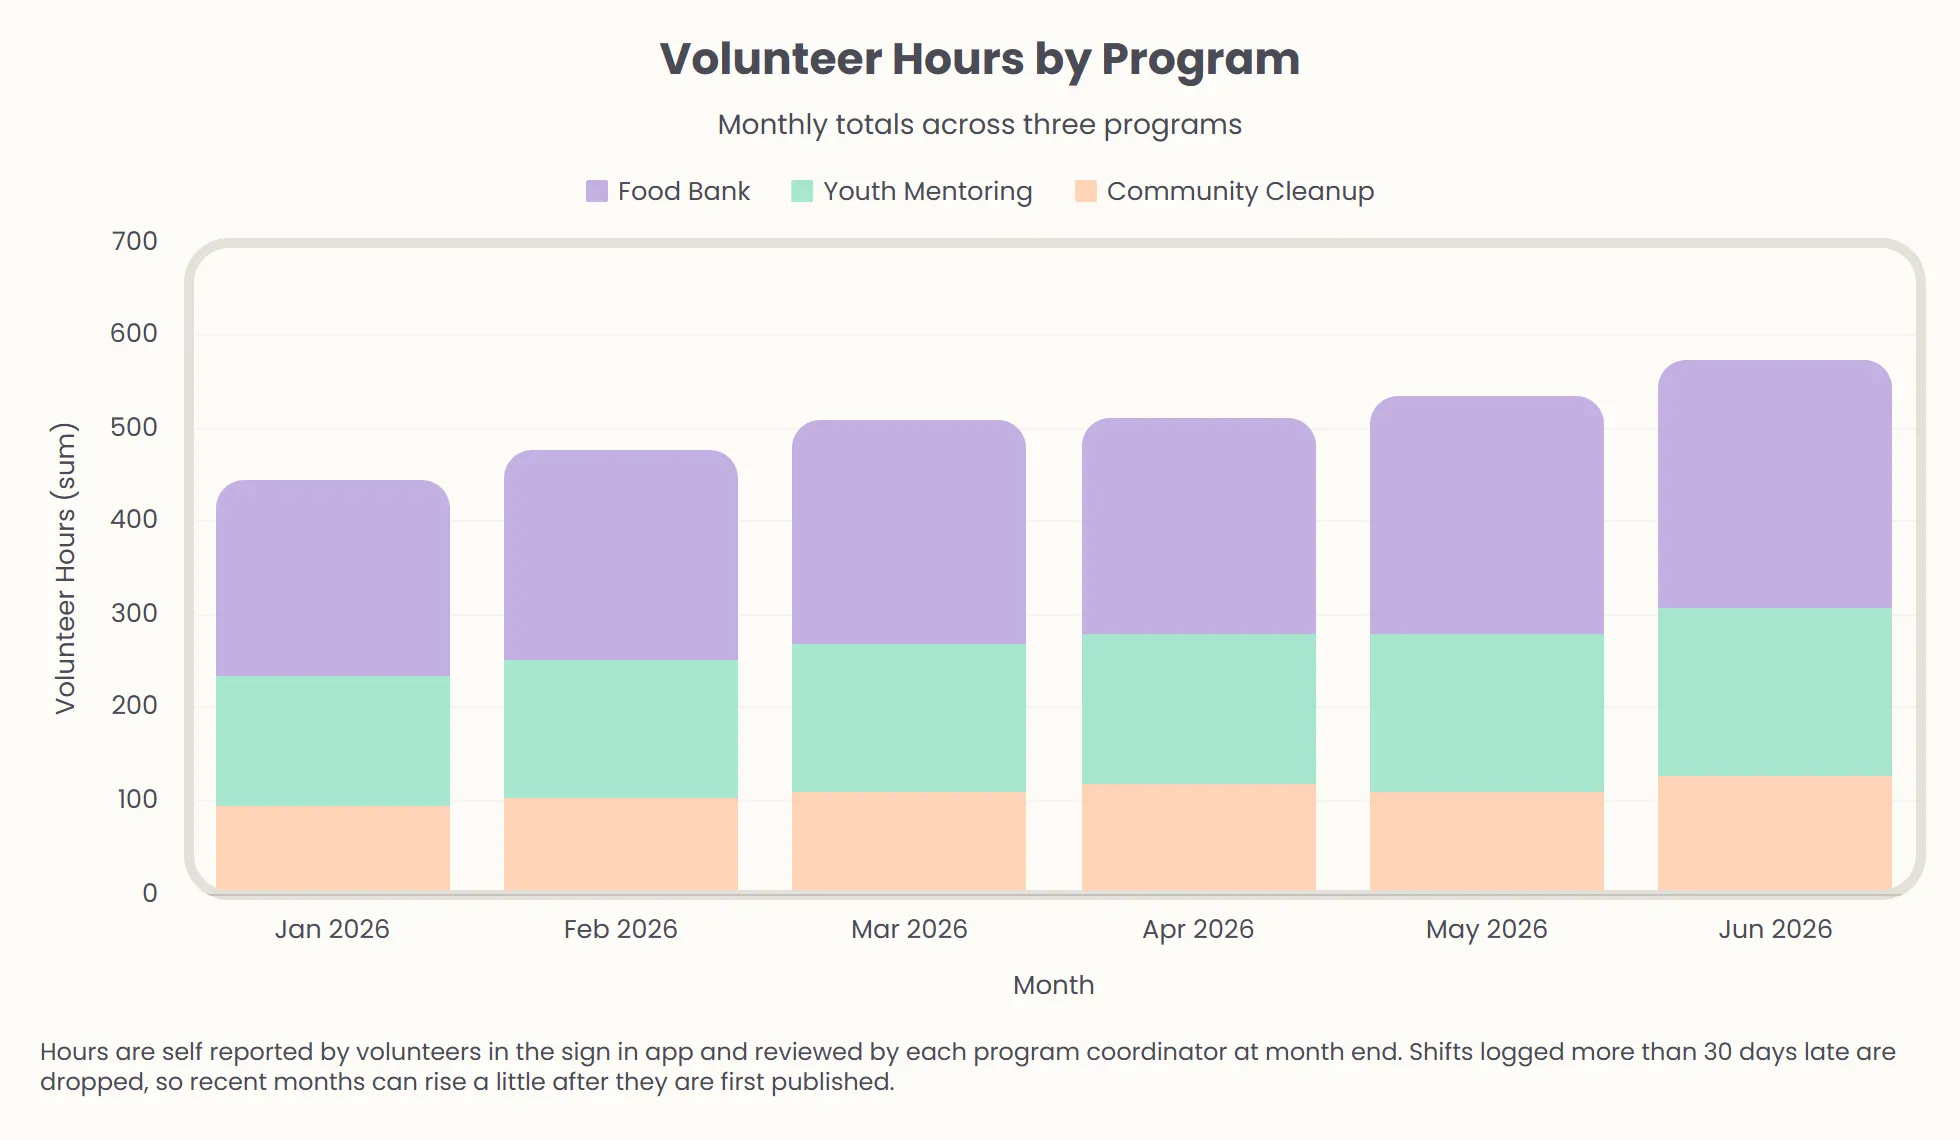 Stacked Bar Chart
Volunteer Hours by Program
Volunteer hours logged each month across three community programs.
View template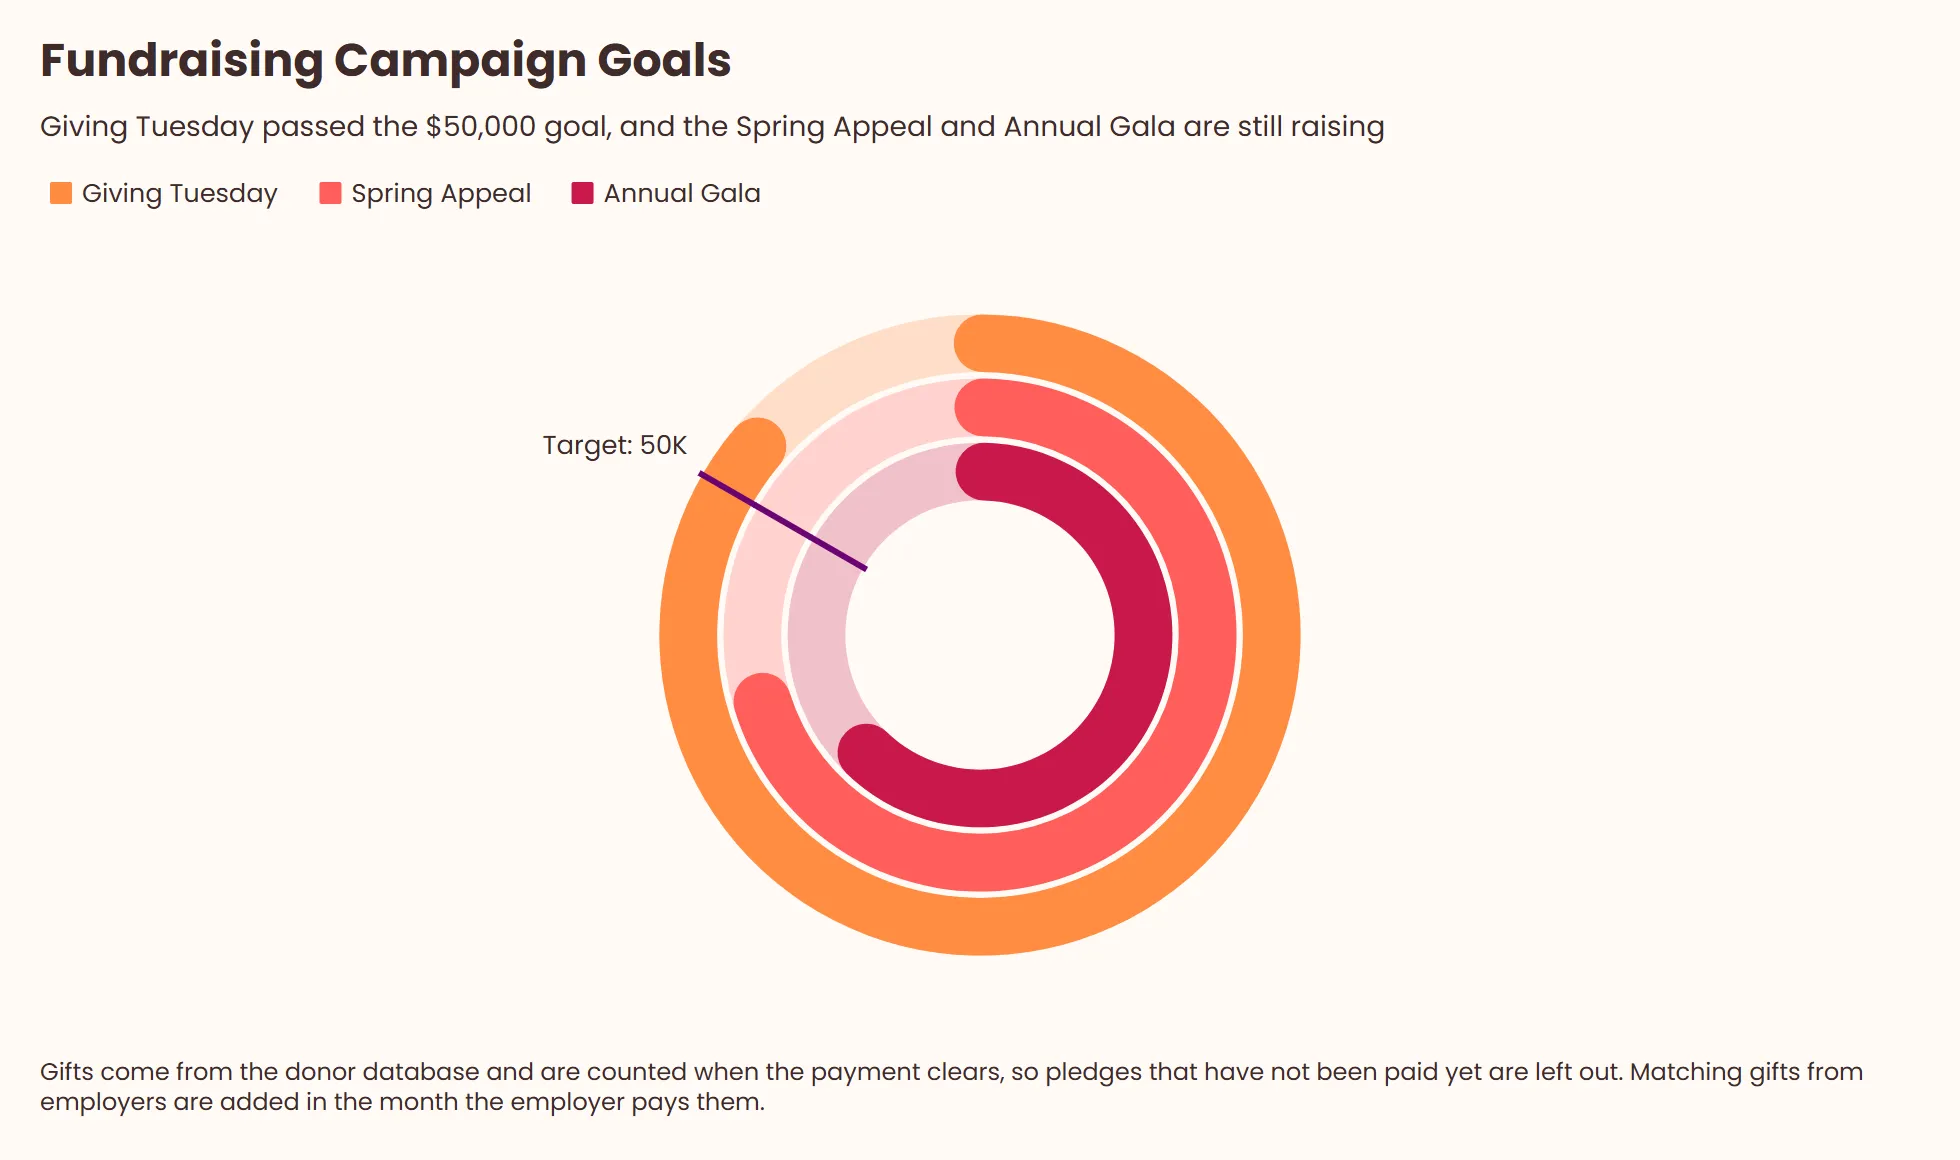 Grouped Gauge Chart
Fundraising Campaign Goals
Donations to three fundraising campaigns, with one ring per campaign showing progress toward a shared $50,000 goal.
View templateCustomer Experience Chart Templates
Customer experience data comes from surveys, help desks and cancellation flows. These templates chart satisfaction scores, Net Promoter Score, churn reasons and ticket volume so support and success teams can spot patterns quickly.
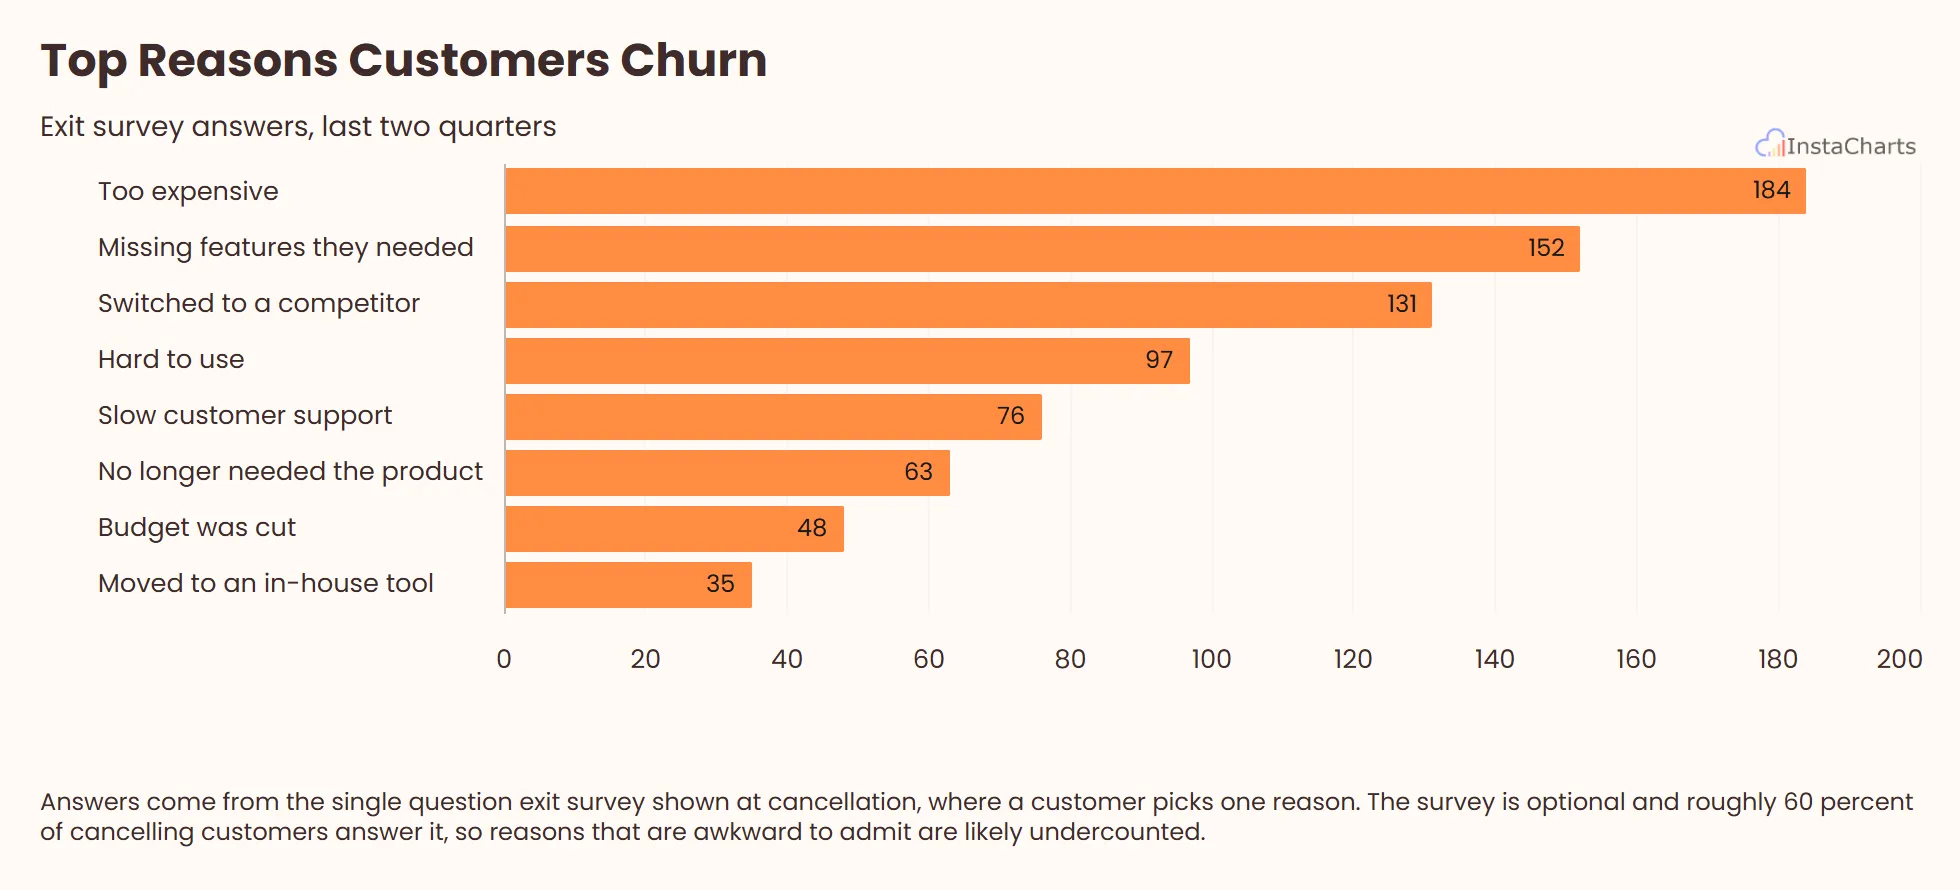 Horizontal Bar Chart
Top Reasons Customers Churn
Exit survey answers from customers who cancelled, counted by the reason they gave and ranked as horizontal bars.
View template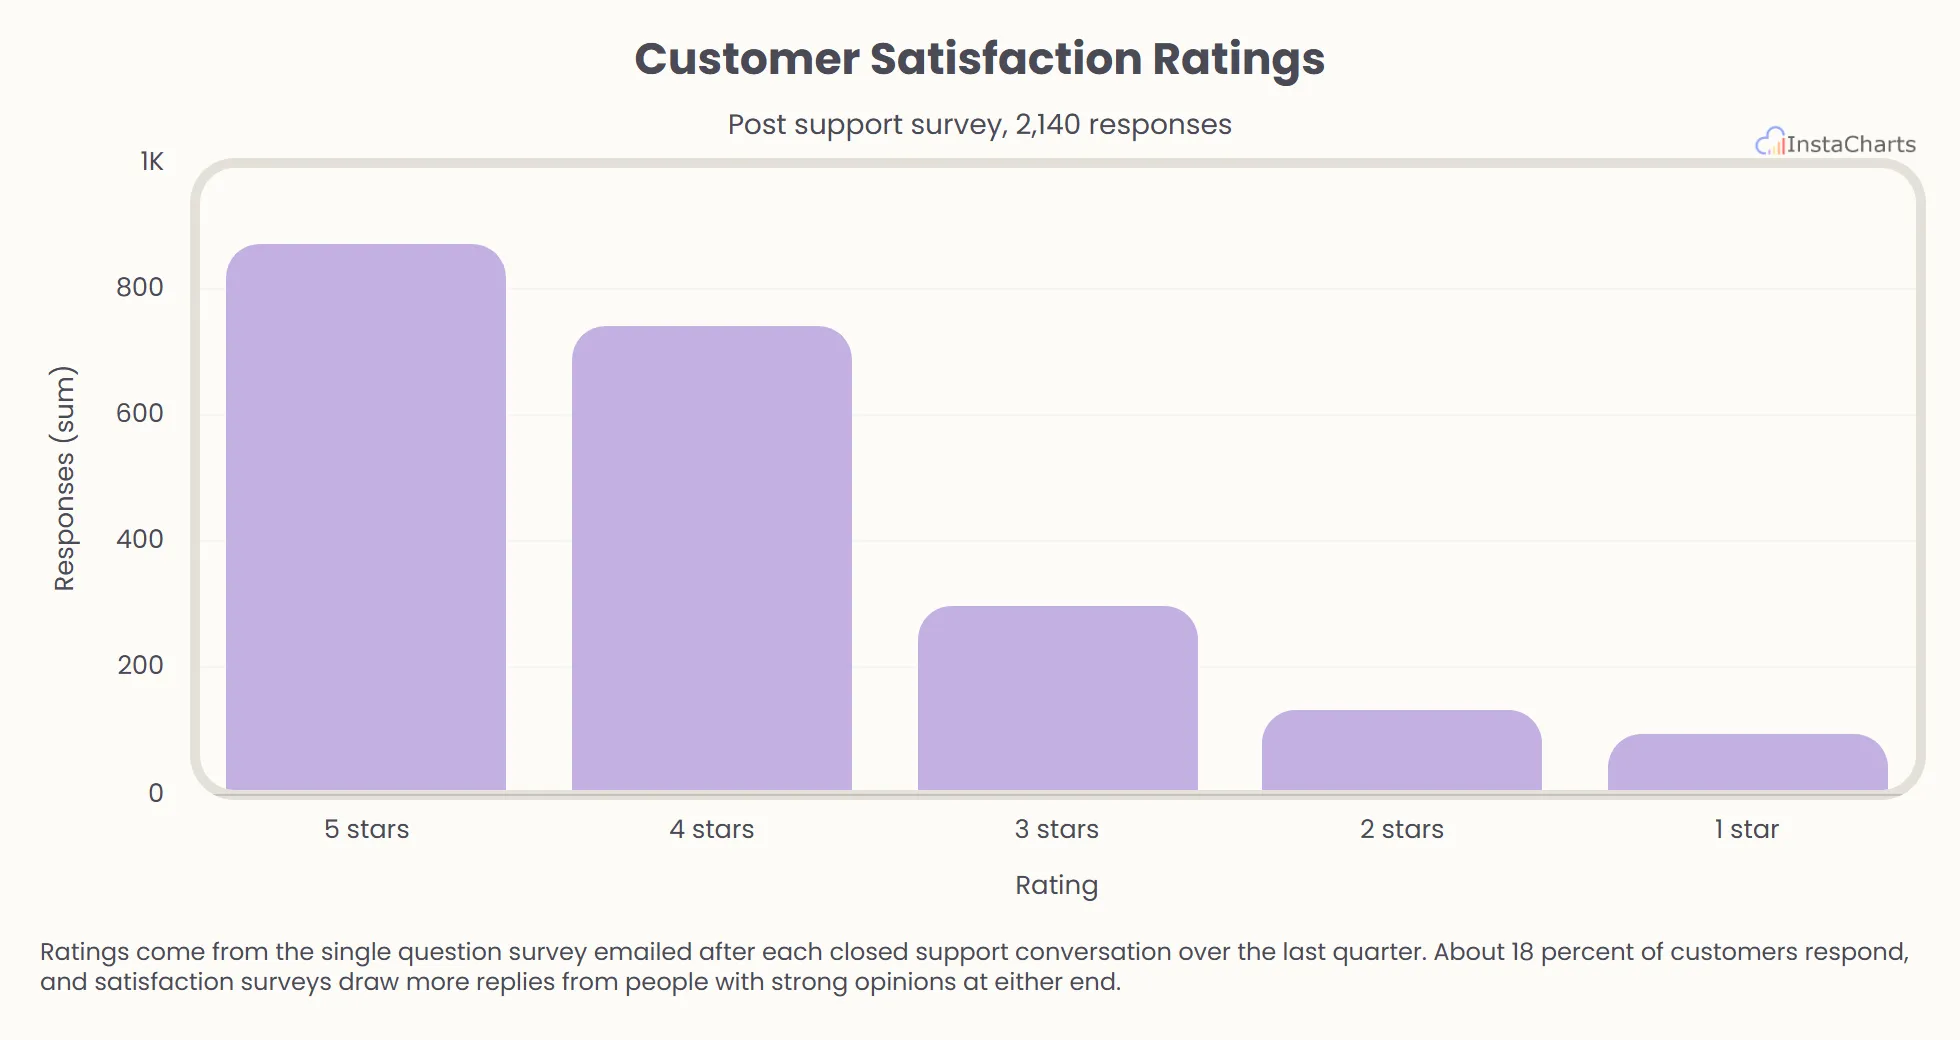 Bar Chart
Customer Satisfaction Ratings
How many customers picked each star rating in the survey sent after a support conversation.
View template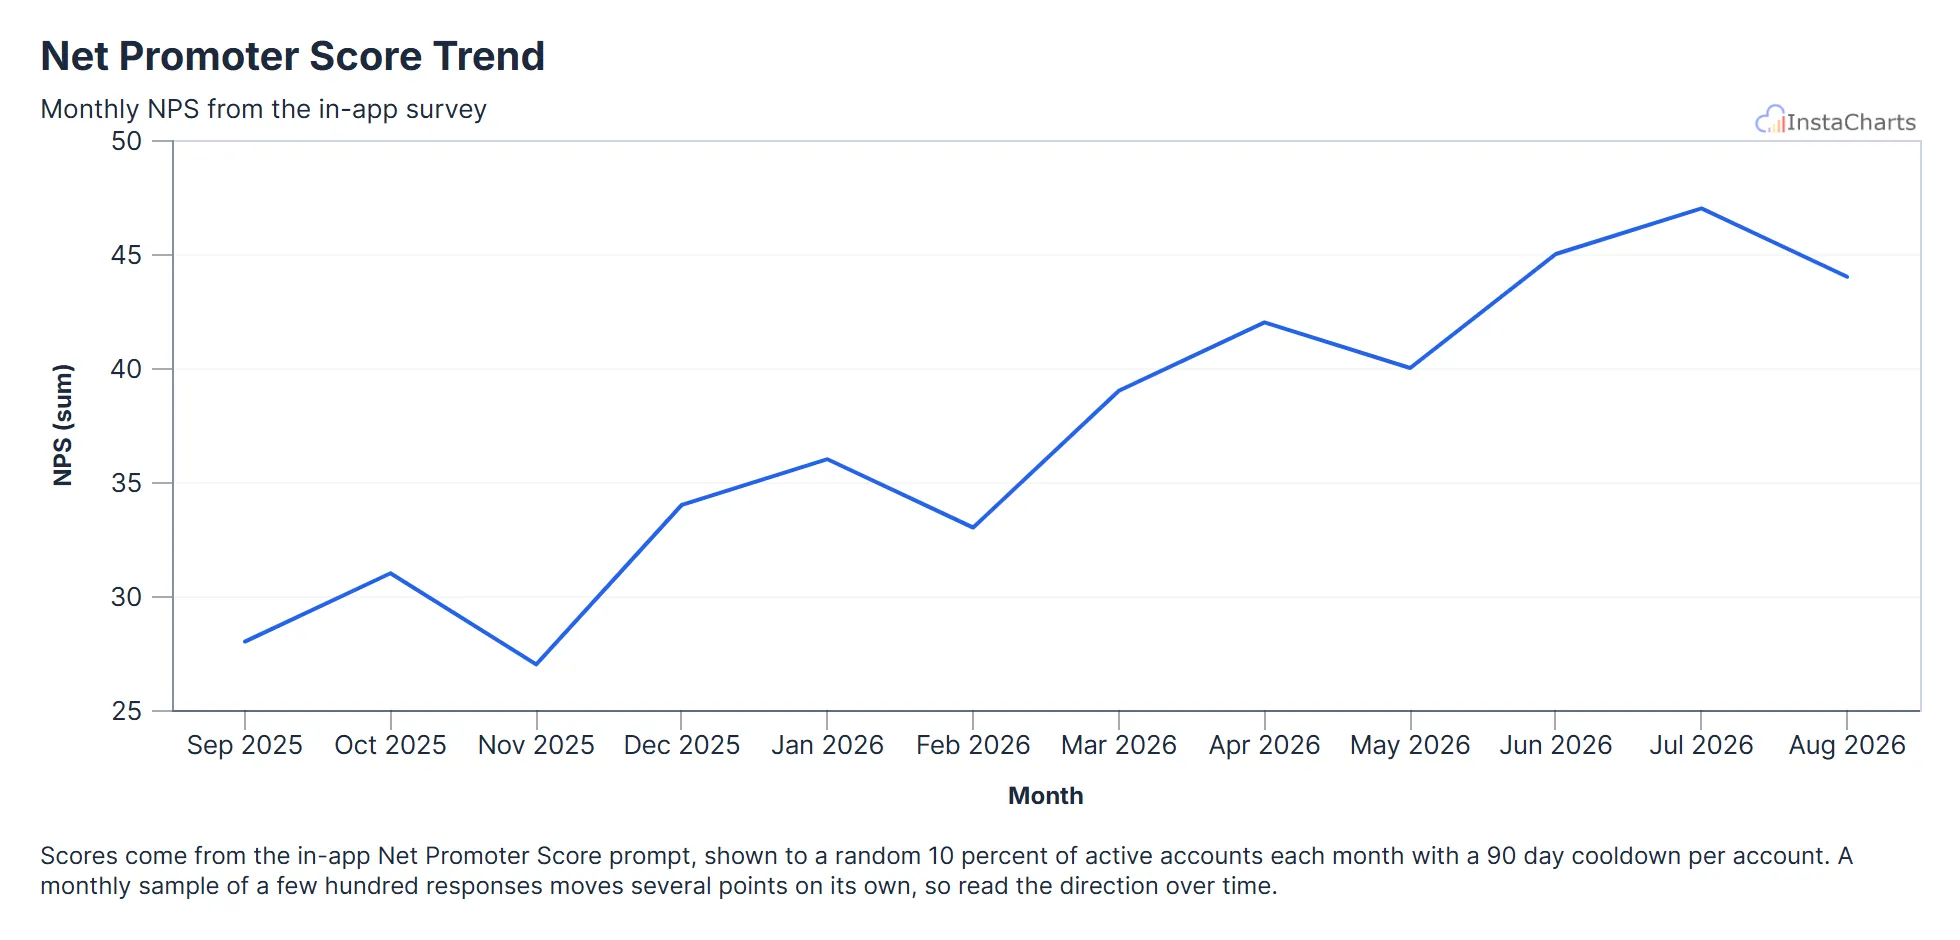 Line Chart
Net Promoter Score Trend
Net Promoter Score from the in-app survey for each month over the last year.
View template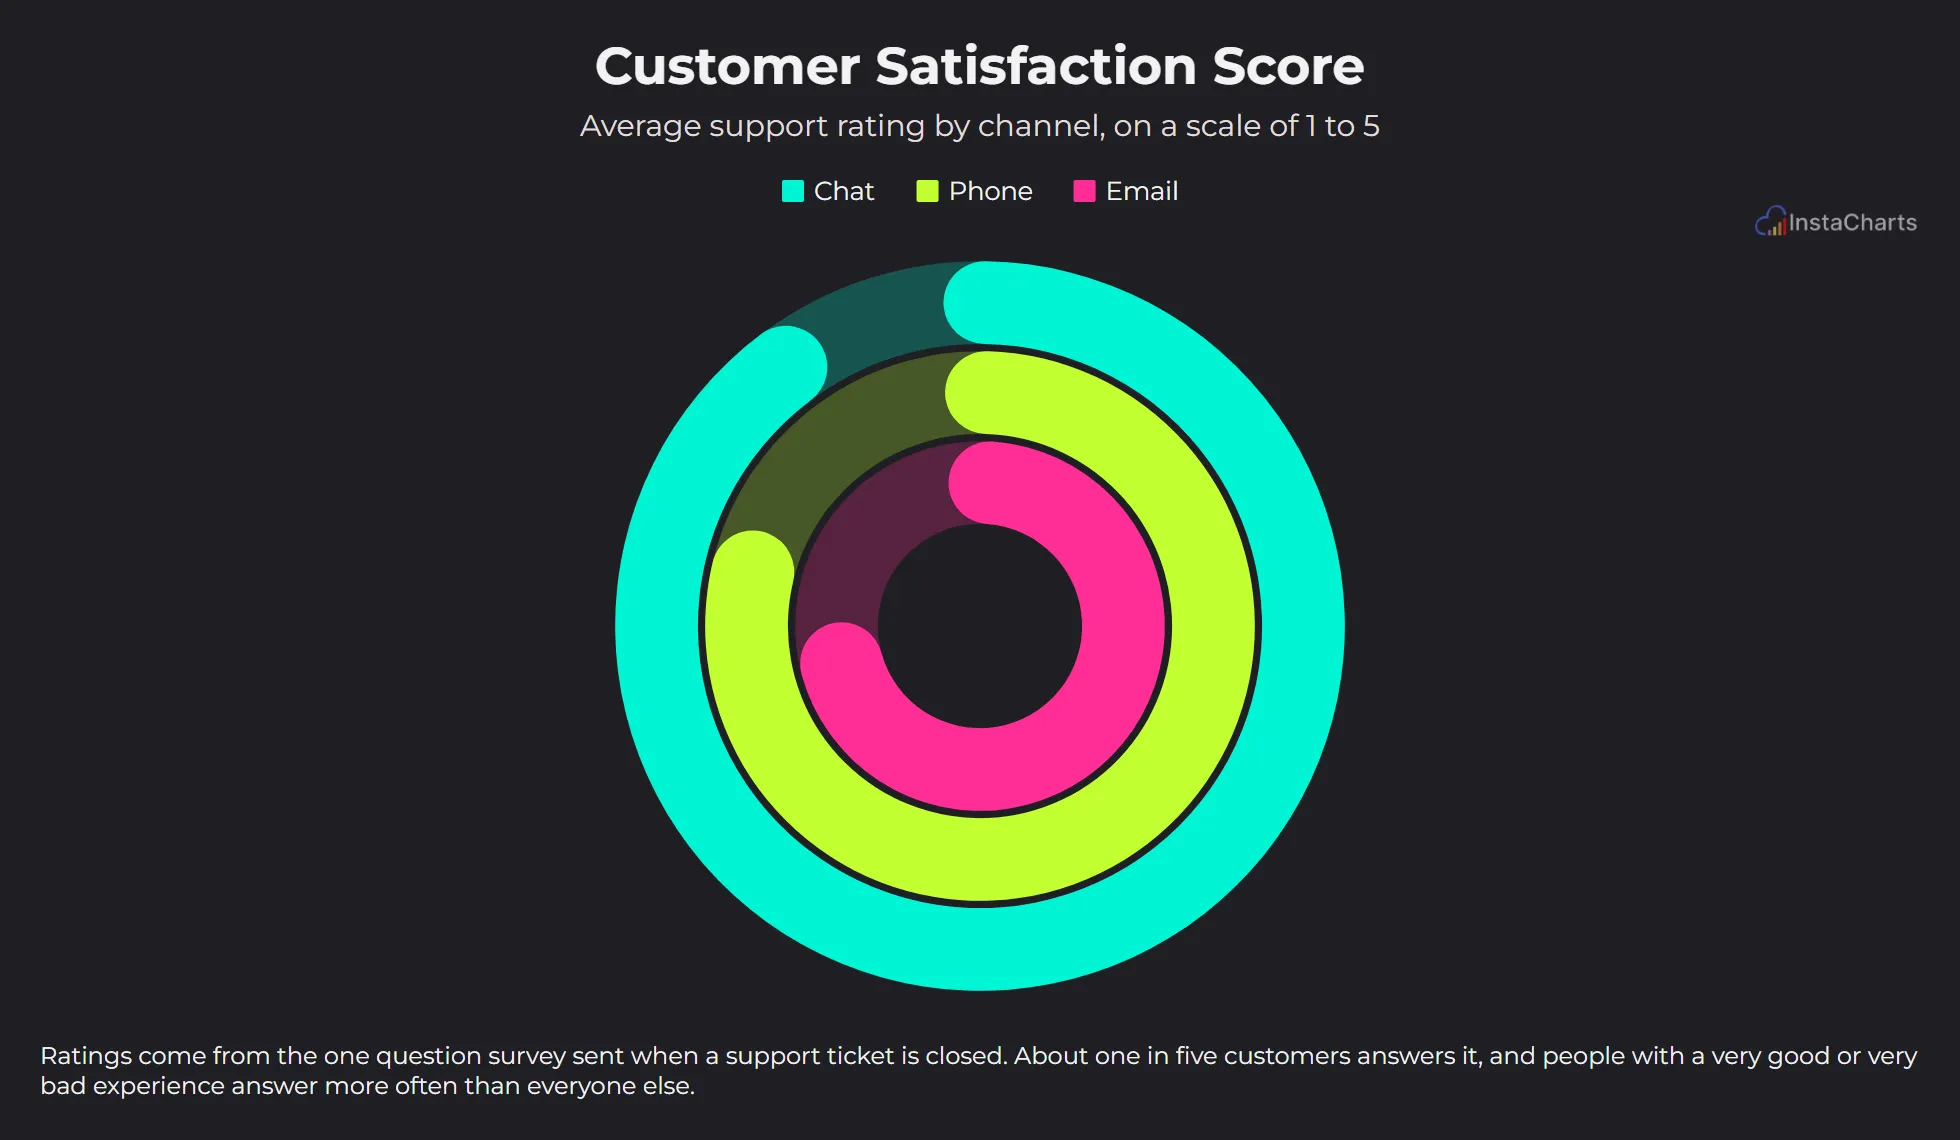 Grouped Gauge Chart
Customer Satisfaction Score
Support ticket ratings from 1 to 5, averaged for each support channel, with one ring per channel filling toward a perfect 5.
View template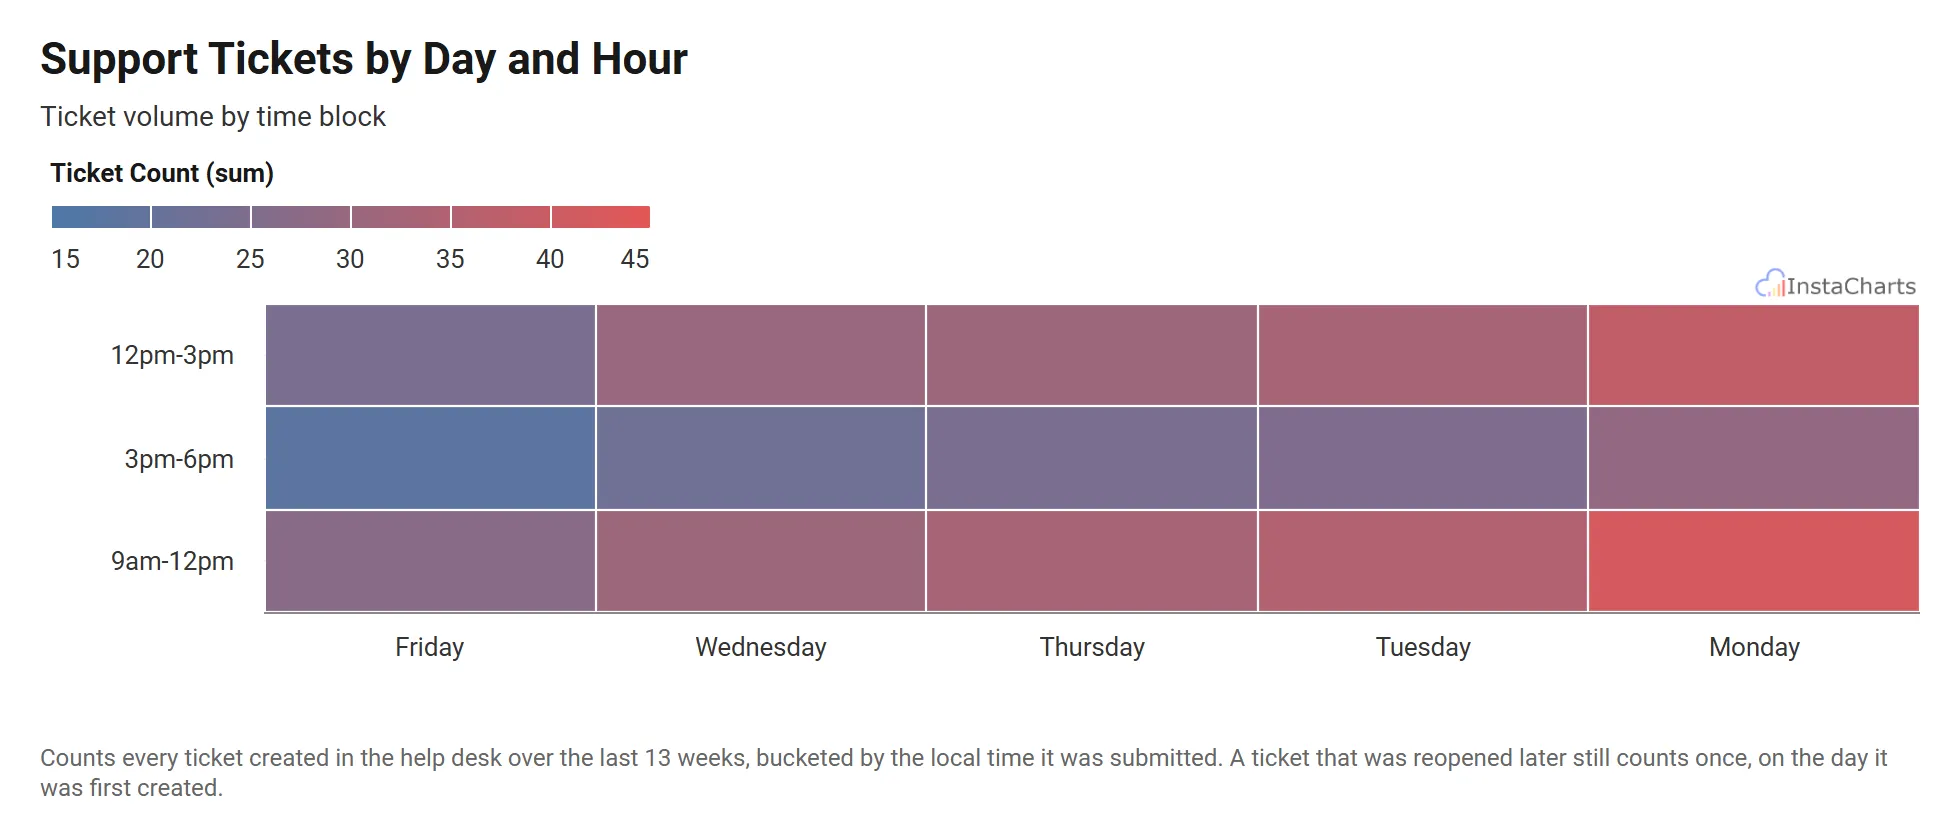 Heatmap
Support Tickets by Day and Hour
Customer support ticket volume by day of the week and time block.
View templateSaaS and Product Chart Templates
Product and growth teams look at plan mix, feature requests and site performance to decide what to build next. These templates chart each of those with sample data shaped like a billing export, a product survey or a monitoring tool.
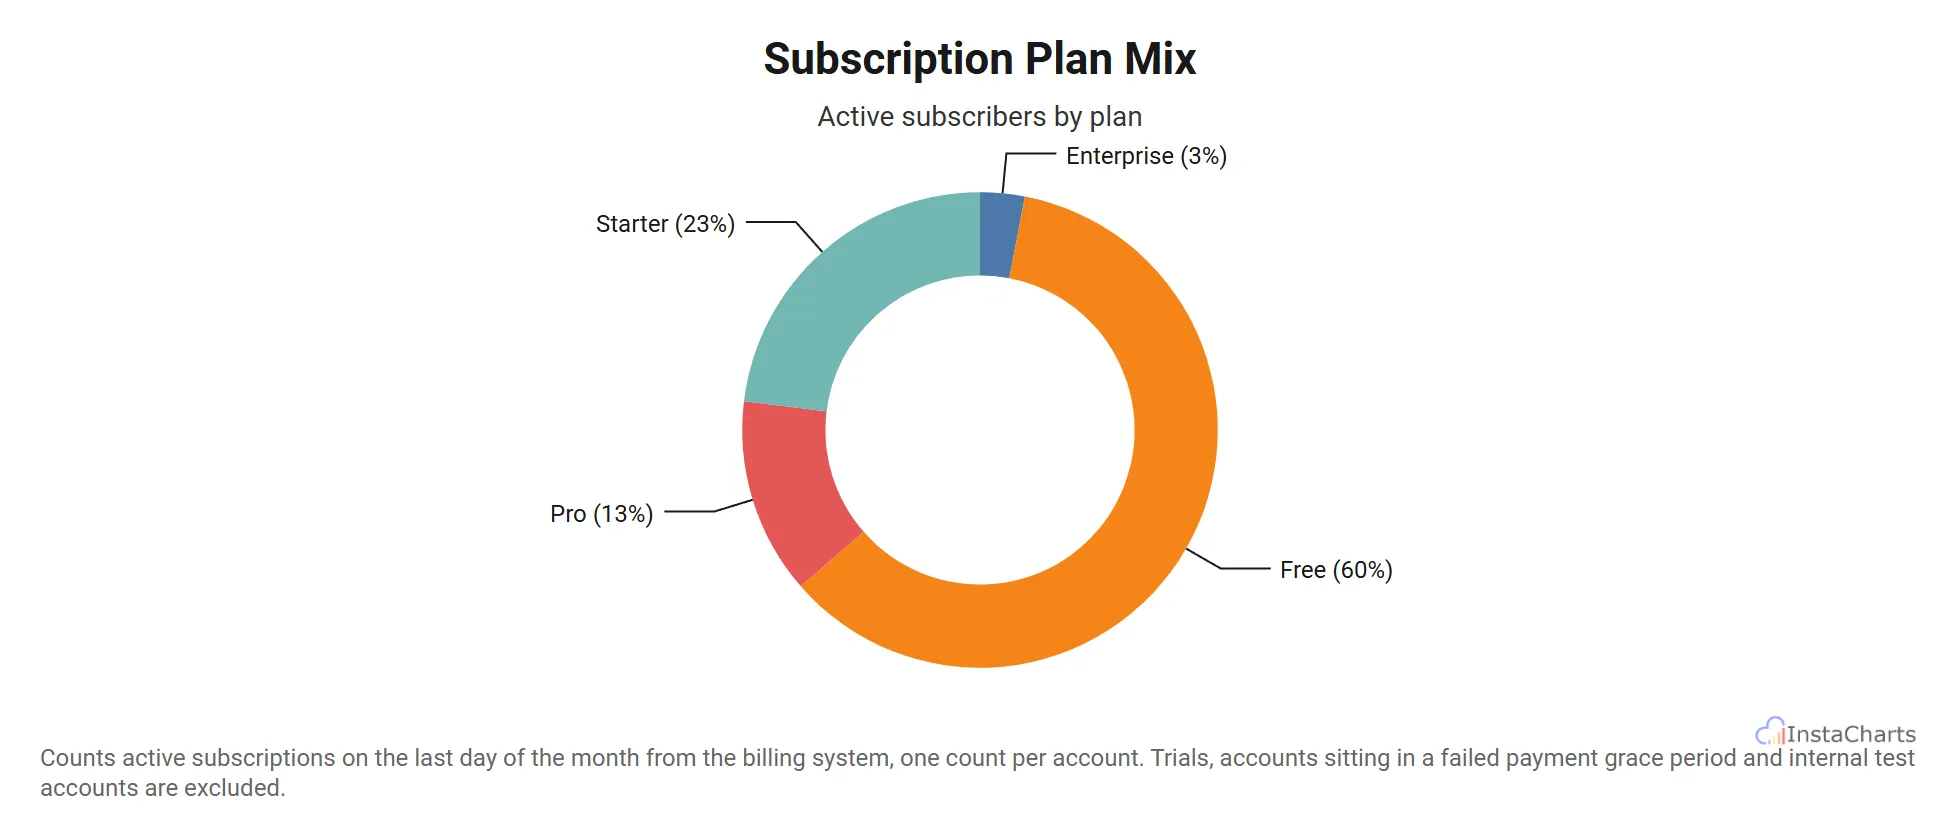 Donut Chart
Subscription Plan Mix
Active subscriber counts across four pricing tiers, from free to enterprise, shown as a donut.
View template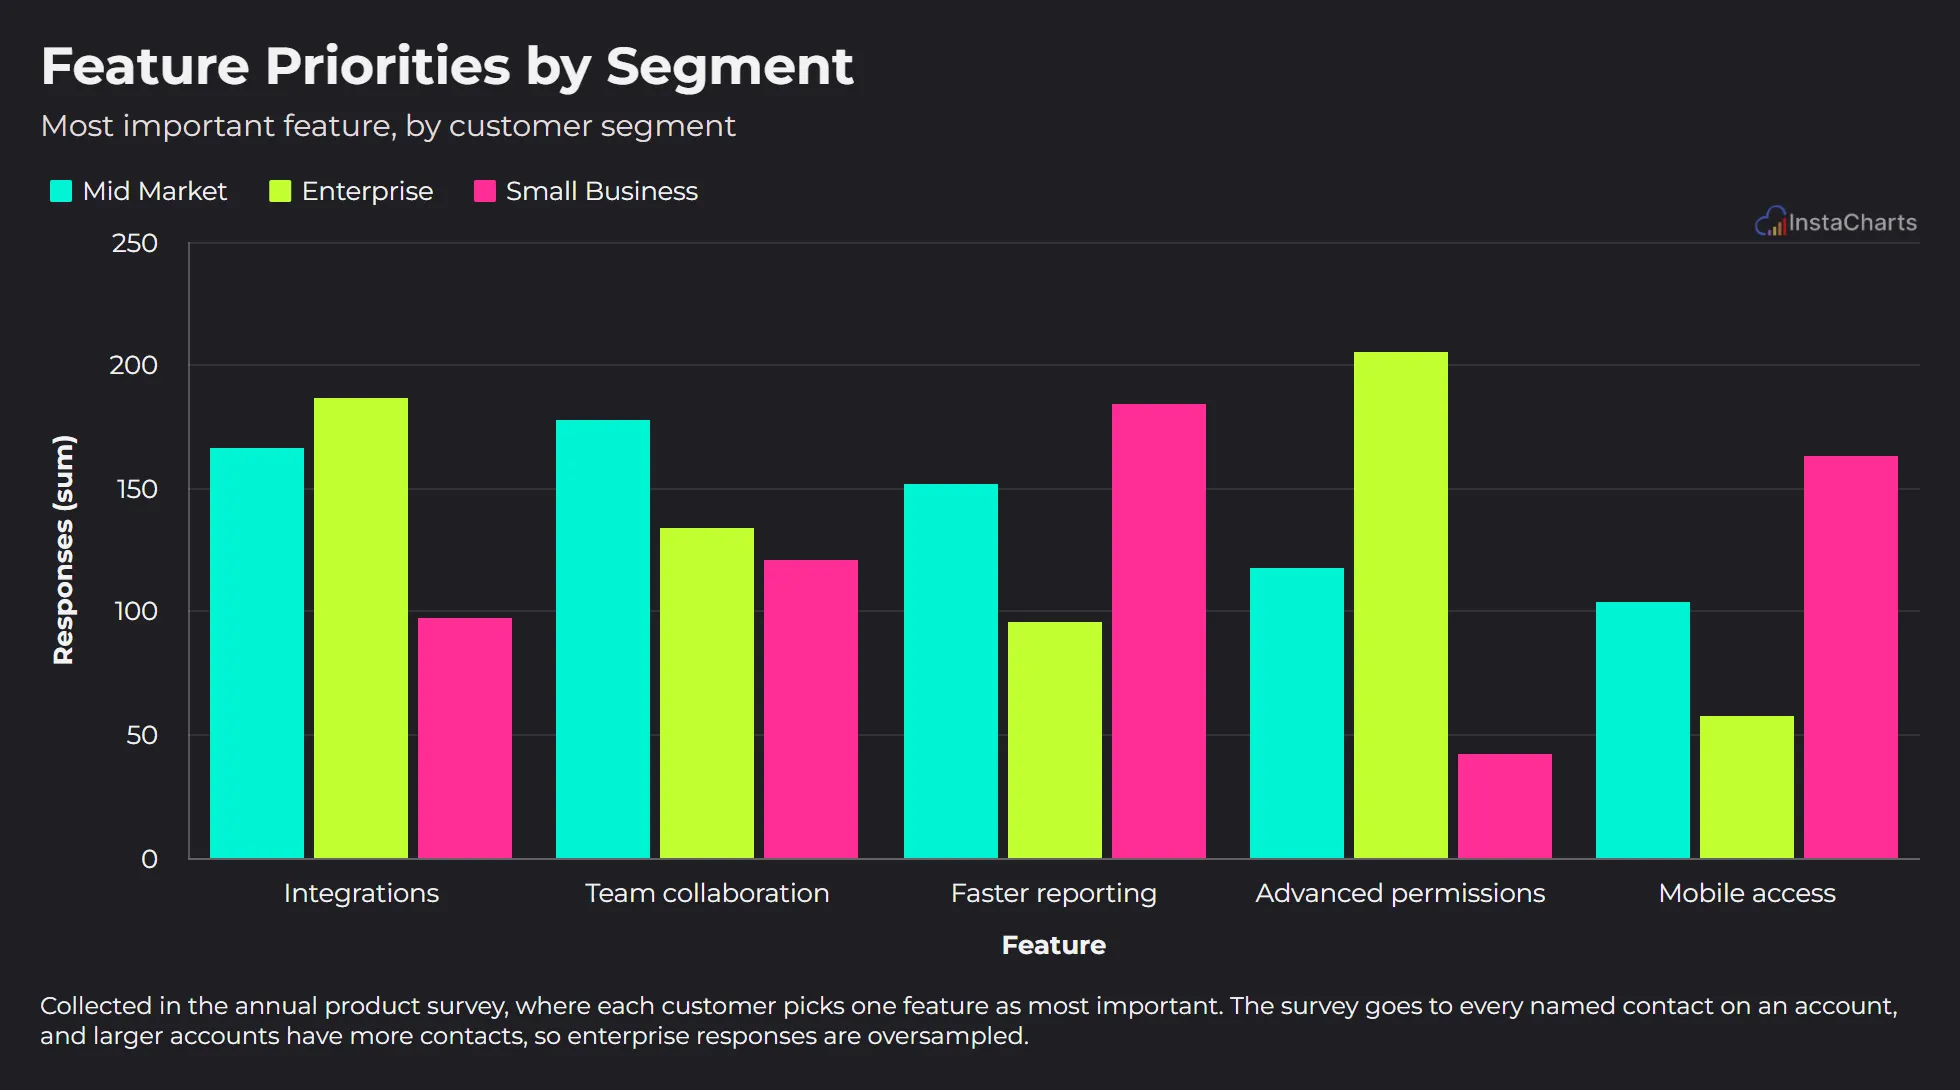 Grouped Bar Chart
Feature Priorities by Segment
The feature each customer segment picked as most important in the annual product survey.
View template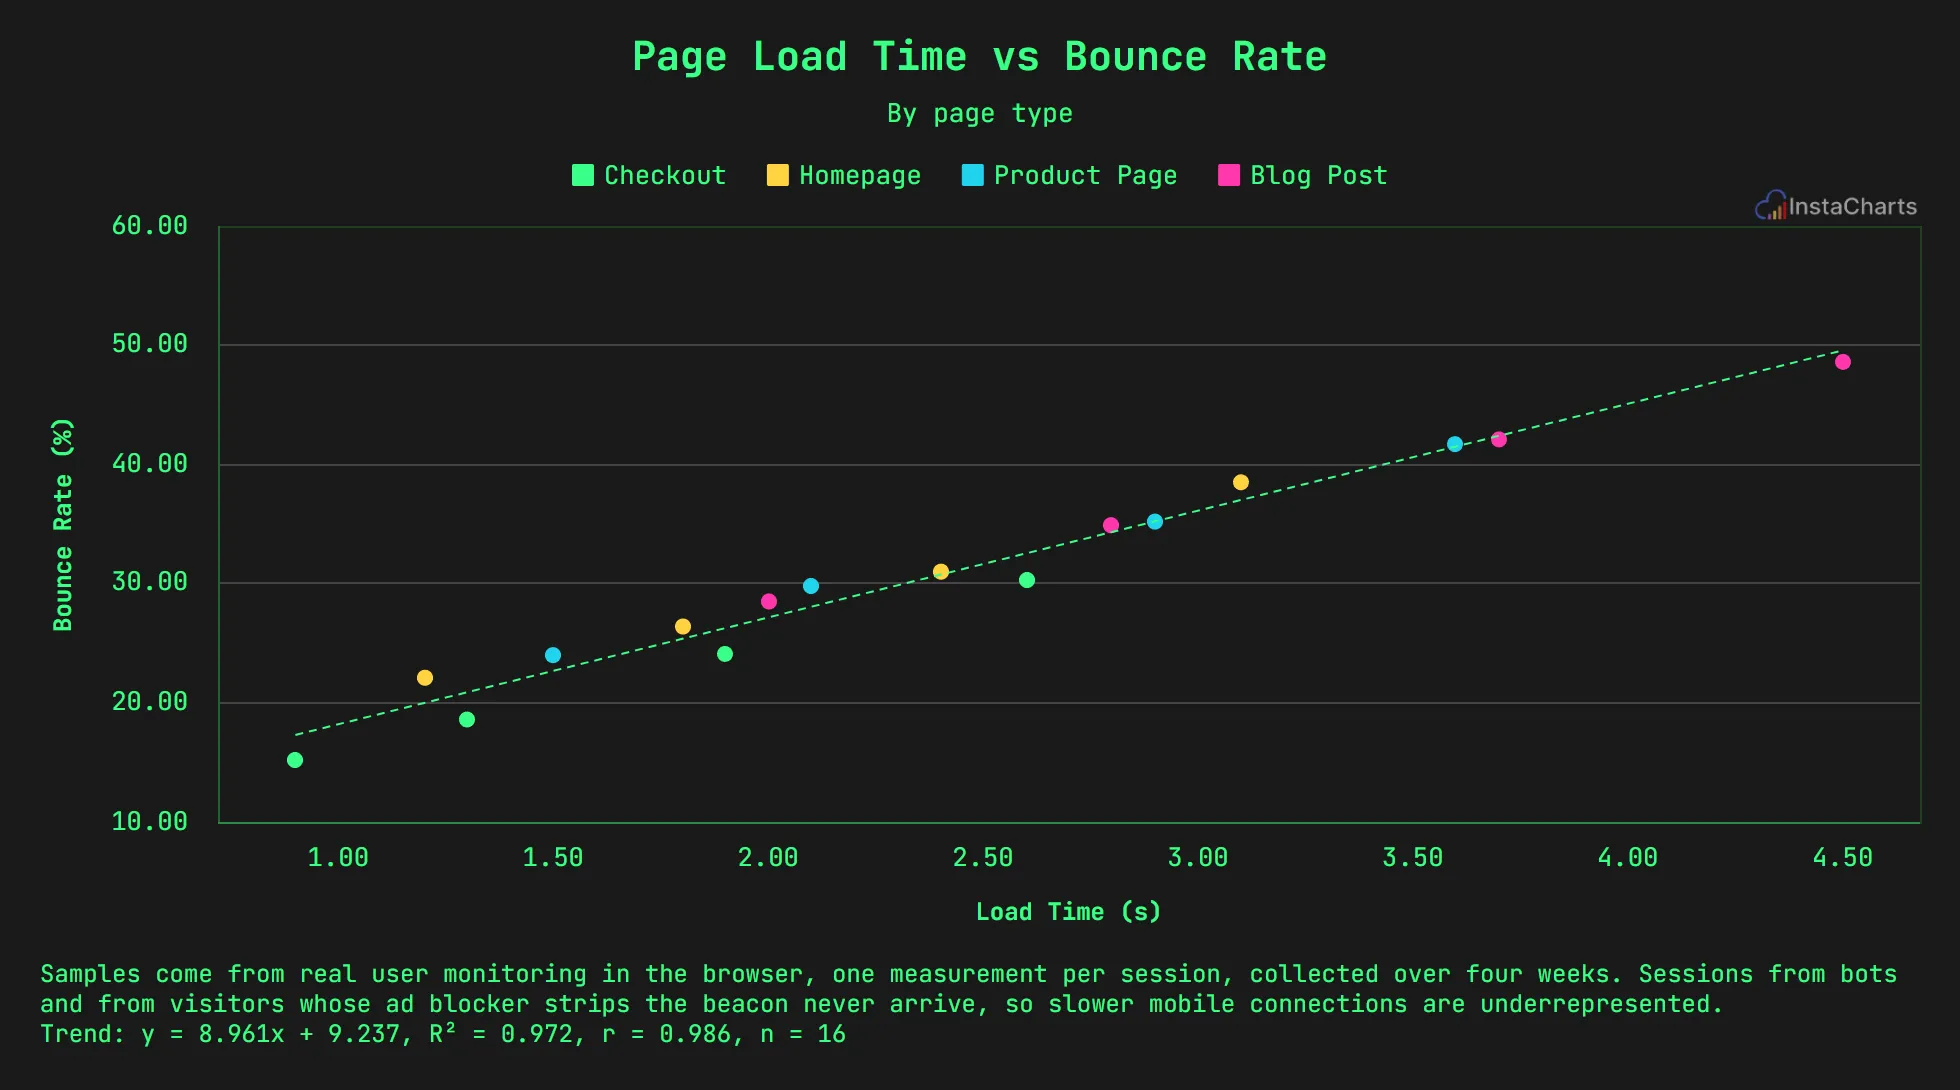 Grouped Scatter Plot
Page Load Time vs Bounce Rate
Page load time and bounce rate samples across different page types on a website.
View templateScience Chart Templates
Lab and research data can run from nanometers to billions of cells in a single study. These templates chart a bacterial growth curve, the visible light spectrum and wastewater monitoring with values written in scientific notation, ready for a lab report, poster or public dashboard.
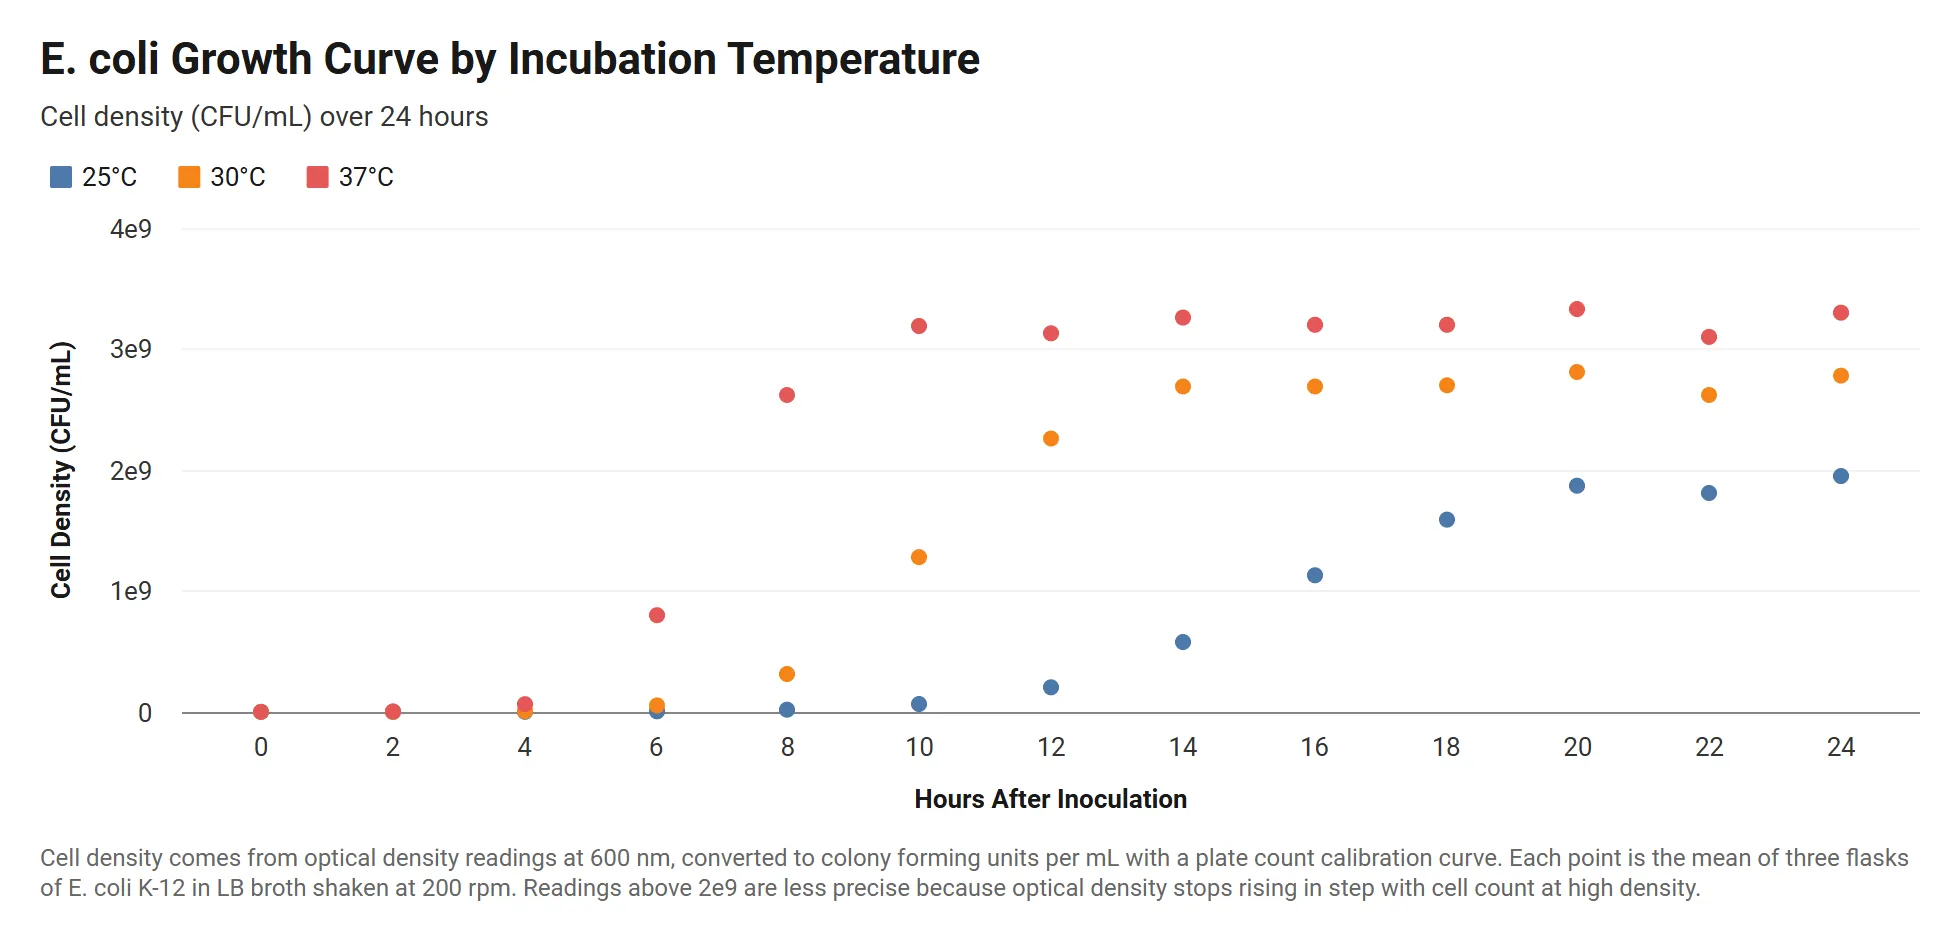 Grouped Scatter Plot
Bacterial Growth Curve by Temperature
E. coli cell density over 24 hours at three incubation temperatures, with readings written in scientific notation.
View template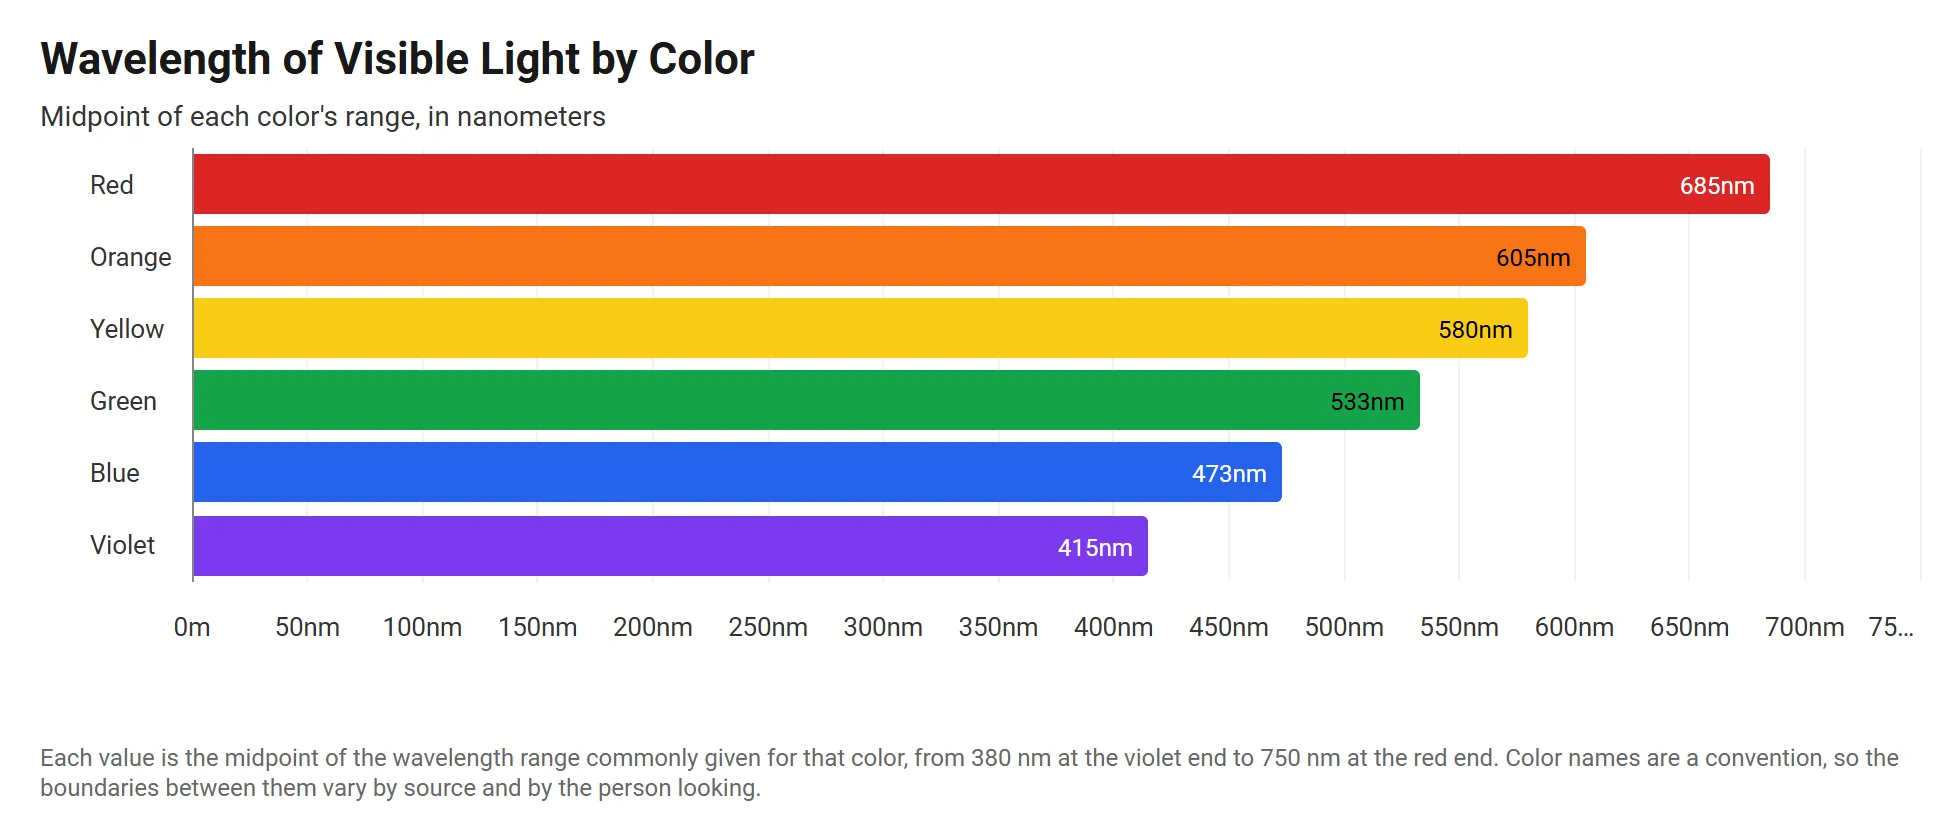 Horizontal Stacked Bar Chart
Visible Light Wavelengths by Color
The wavelength of each color in the visible spectrum, in meters, drawn as horizontal bars from violet to red.
View template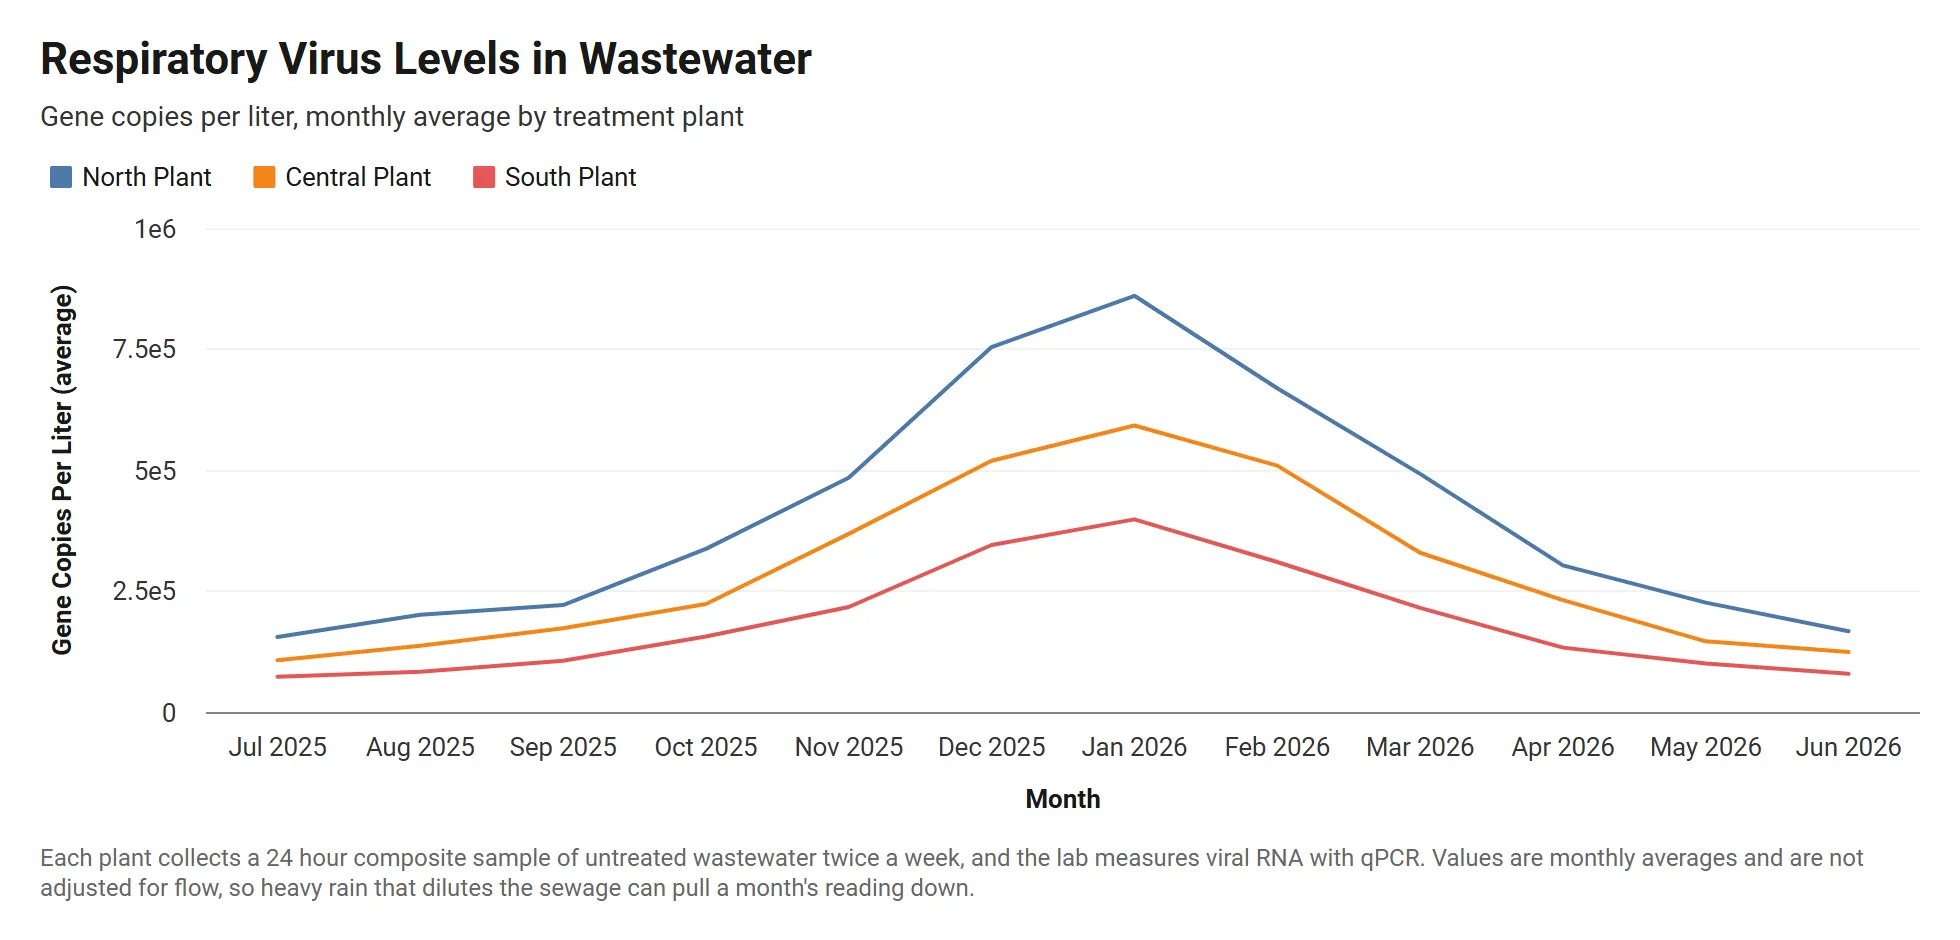 Grouped Line Chart
Wastewater Viral Load by Treatment Plant
Monthly respiratory virus levels in wastewater at three treatment plants, in gene copies per liter written in scientific notation.
View templateFAQ
Chart template FAQ
Are these chart templates free?
Yes. Every template opens in the InstaCharts chart maker with no account needed. Sign up free to save your chart, share it with a link or embed it on a website.
How do I use a chart template with my own data?
Open a template, then paste in your spreadsheet or upload a CSV or Excel file with the same kind of columns. The chart keeps the template's chart type, and each template page lists what every column does.
Can I change the colors and text of a template?
Yes. Titles, subtitles, captions, colors, themes, labels and axes can all be changed in the chart maker after you open a template.
Can I find these templates inside InstaCharts?
Yes. Choose the Templates tab when you create a new sheet in InstaCharts to import any template with its sample data and finished chart.
Looking for a chart type instead? Browse every chart maker. Need a whole dashboard? Start from a dashboard template.
Make your first chart in seconds
InstaCharts makes data visualization easy, so you can build clear reports without design experience.