
Customer Satisfaction Score Gauge Template
Support ticket ratings from 1 to 5, averaged for each support channel, with one ring per channel filling toward a perfect 5.
Average support ratings for each channel and show them as rings that fill toward a perfect 5. The template uses raw ticket ratings, so the chart does the averaging for you.
- 24 sample rows
- 3 columns
- Export, share or embed
Customer Satisfaction Score
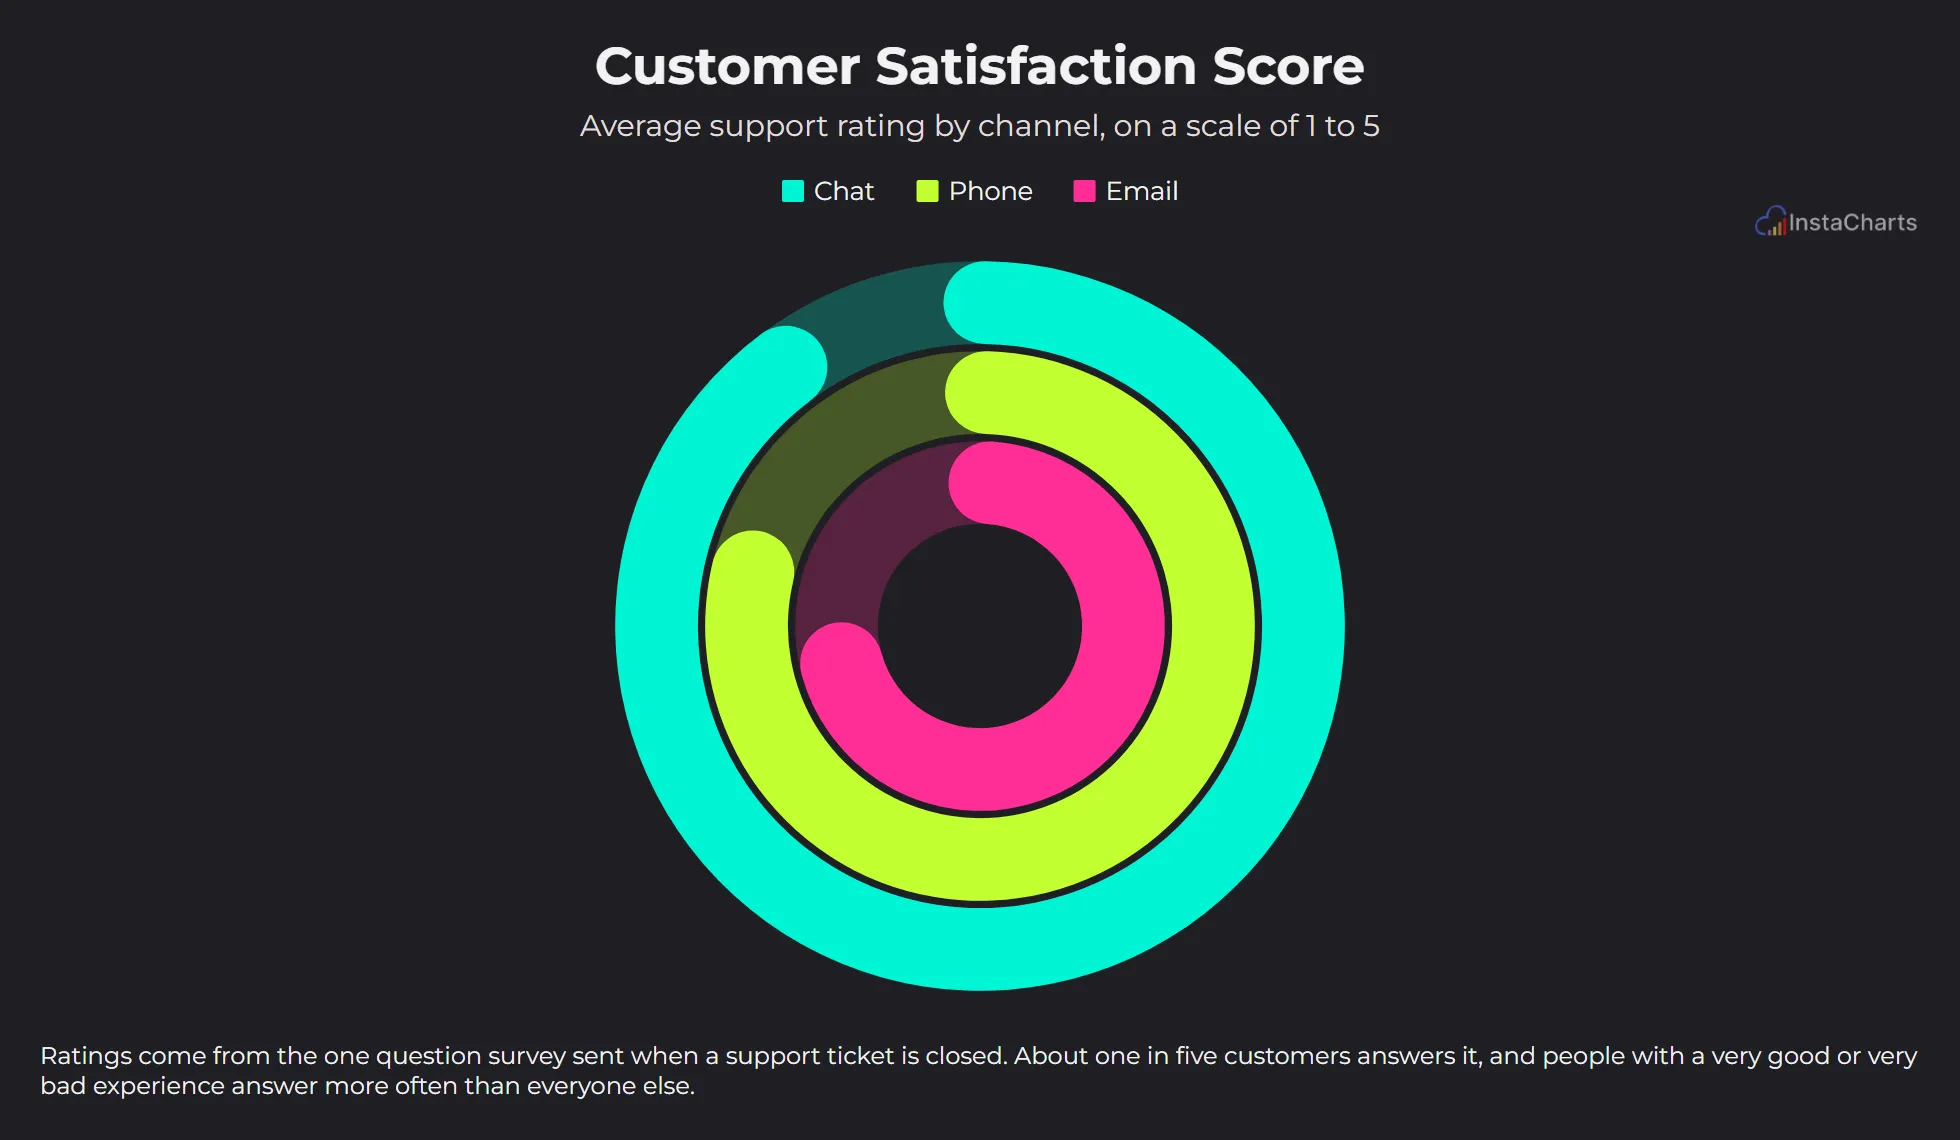
A live grouped gauge chart drawn from the sample data below. Click Edit this template to change it.
About this template
What the customer satisfaction score chart shows
Chat has the highest average in the sample at 4.6 out of 5 across 10 ratings. Phone averages 4.2 across 6 ratings and email 3.9 across 8.
Each ring reads like a progress bar toward a perfect score, so the channels compare quickly on a support dashboard.
About the sample data
Ratings come from the one question survey sent when a support ticket is closed. About one in five customers answers it, and people with a very good or very bad experience answer more often than everyone else.
Sample data
Sample data for the customer satisfaction score template
The template loads these 24 rows. Keep the same columns, replace the rows with your own numbers, and the grouped gauge chart redraws to match.
Response Date
Kept in the sheet for other charts
Support Channel
Rings, one per value
Rating
Value, averaged for each ring
| Response Date | Support Channel | Rating |
|---|---|---|
| 2026-09-01 | 5 | |
| 2026-09-01 | Chat | 4 |
| 2026-09-02 | Phone | 5 |
| 2026-09-03 | 3 | |
| 2026-09-04 | Chat | 4 |
| 2026-09-07 | Chat | 5 |
| 2026-09-08 | Phone | 5 |
| 2026-09-09 | 4 | |
| 2026-09-10 | 2 | |
| 2026-09-11 | Chat | 5 |
| 2026-09-14 | Phone | 4 |
| 2026-09-15 | Chat | 4 |
| 2026-09-16 | 5 | |
| 2026-09-17 | Phone | 3 |
| 2026-09-18 | Chat | 5 |
| 2026-09-21 | 4 | |
| 2026-09-22 | Chat | 5 |
| 2026-09-23 | Phone | 4 |
| 2026-09-24 | Chat | 5 |
| 2026-09-25 | 5 | |
| 2026-09-28 | Phone | 4 |
| 2026-09-28 | 3 | |
| 2026-09-29 | Chat | 5 |
| 2026-09-30 | Chat | 4 |
How to use it
How to adapt the customer satisfaction score template
- 1 Click Edit this template to open the chart and its sample data in the InstaCharts chart maker. No account is needed.
- 2 Paste one row per survey response with the channel and the rating. The chart averages them.
- 3 Keep the gauge minimum at 1 and maximum at 5 to match the rating scale.
- 4 Show the response count per channel in the subtitle, since small samples move the average.
- 5 Filter the sheet to the last 30 or 90 days to show recent performance.
- 6 Download the chart as a PNG, SVG or PDF, share it with a link, or embed it on a website. Sign up free to save it.
FAQ
Customer Satisfaction Score template FAQ
Does the chart average the ratings for me?
Yes. The template sets the aggregation to average, so each ring shows the mean rating for its channel.
Can I use a 1 to 10 scale?
Yes. Set the gauge maximum to 10 in the gauge options and the rings fill toward the new top score.
Is this chart template free?
Yes. Click Edit this template to open it in the InstaCharts chart maker with no account needed. Sign up free to save the chart, share it with a link or embed it on a website.
How do I use my own data with this template?
Open the template in the chart maker, then paste in your own spreadsheet or upload a CSV or Excel file with the same kind of columns. The new chart keeps this template's grouped gauge chart type, and you can pick which columns go on each axis.
Learn more about this chart type on the grouped gauge chart maker page.
More templates
Related chart templates
 Horizontal Bar Chart
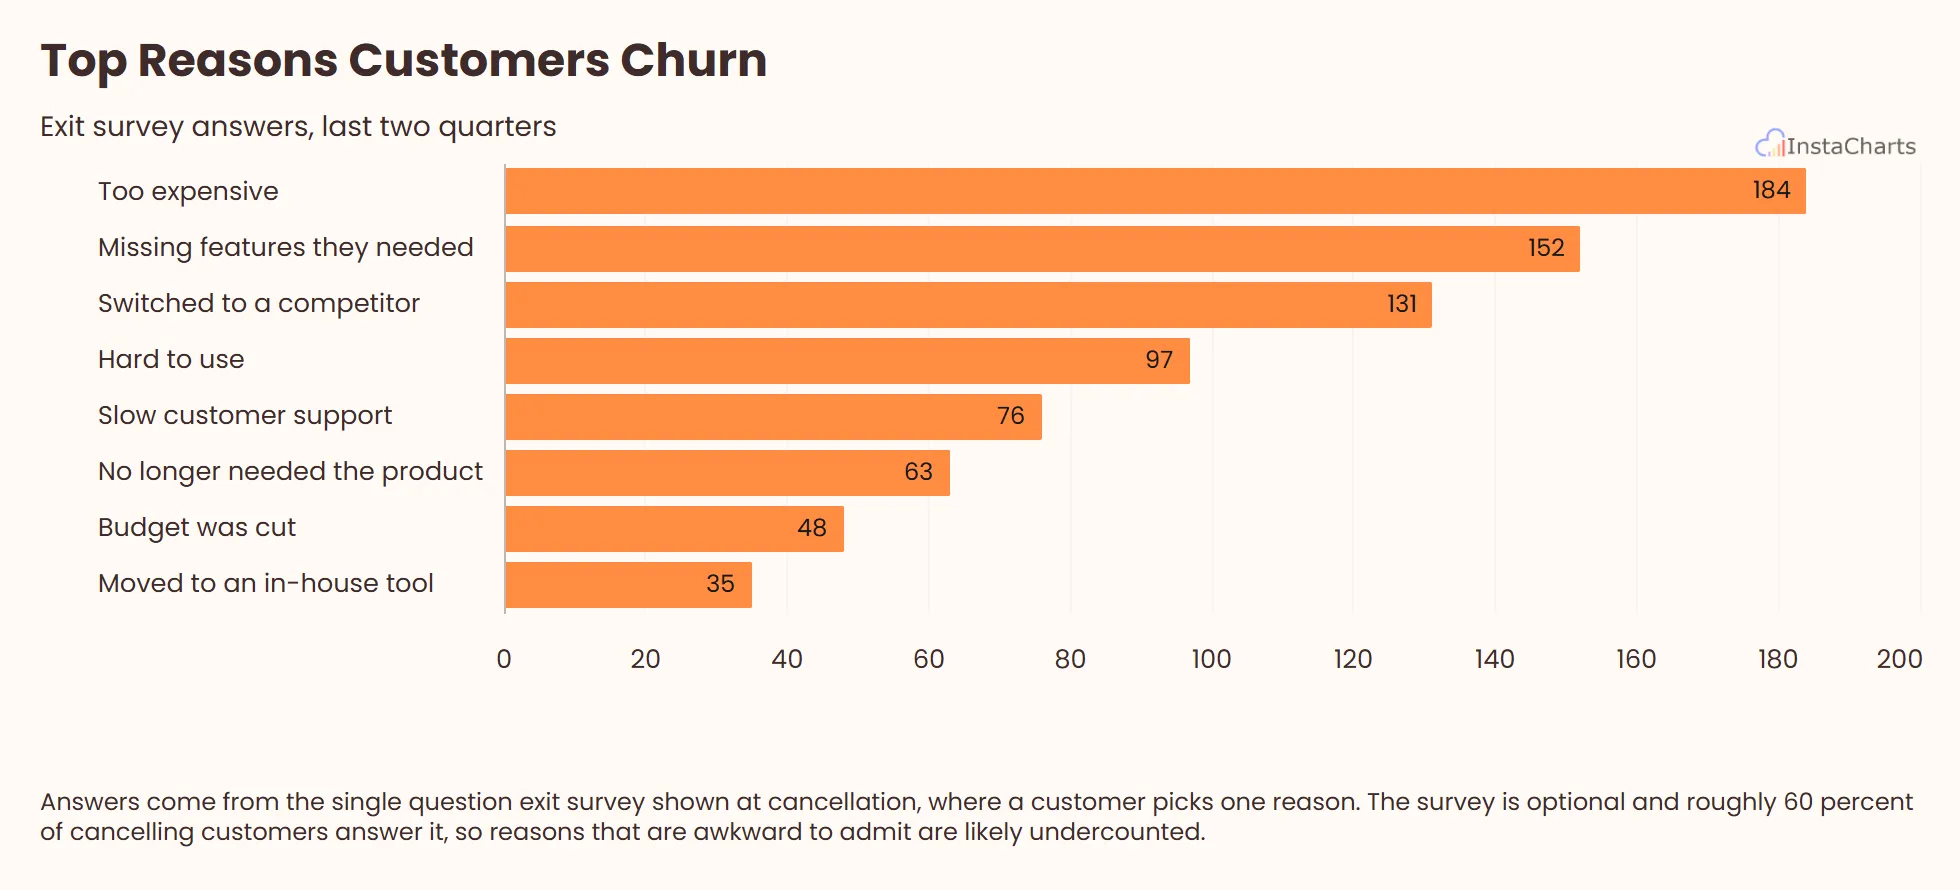
Top Reasons Customers Churn
Exit survey answers from customers who cancelled, counted by the reason they gave and ranked as horizontal bars.
View template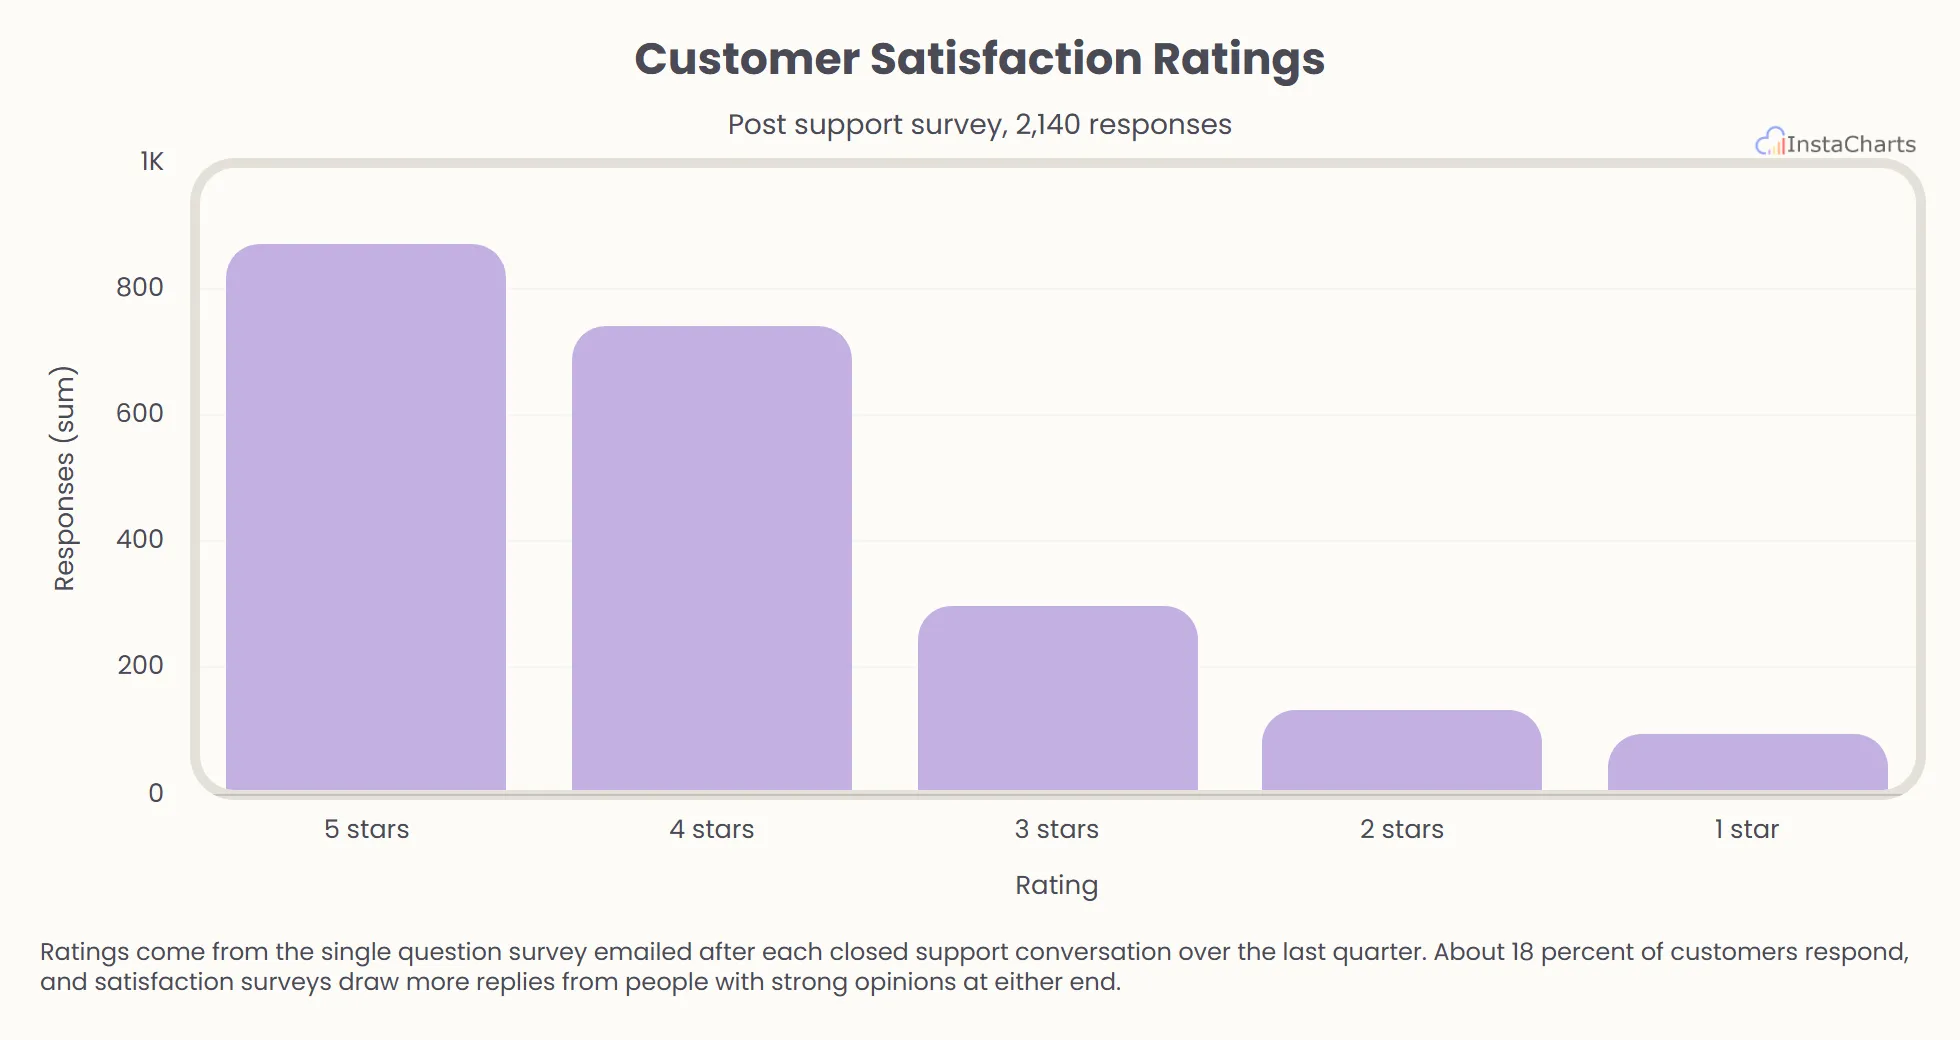 Bar Chart
Customer Satisfaction Ratings
How many customers picked each star rating in the survey sent after a support conversation.
View template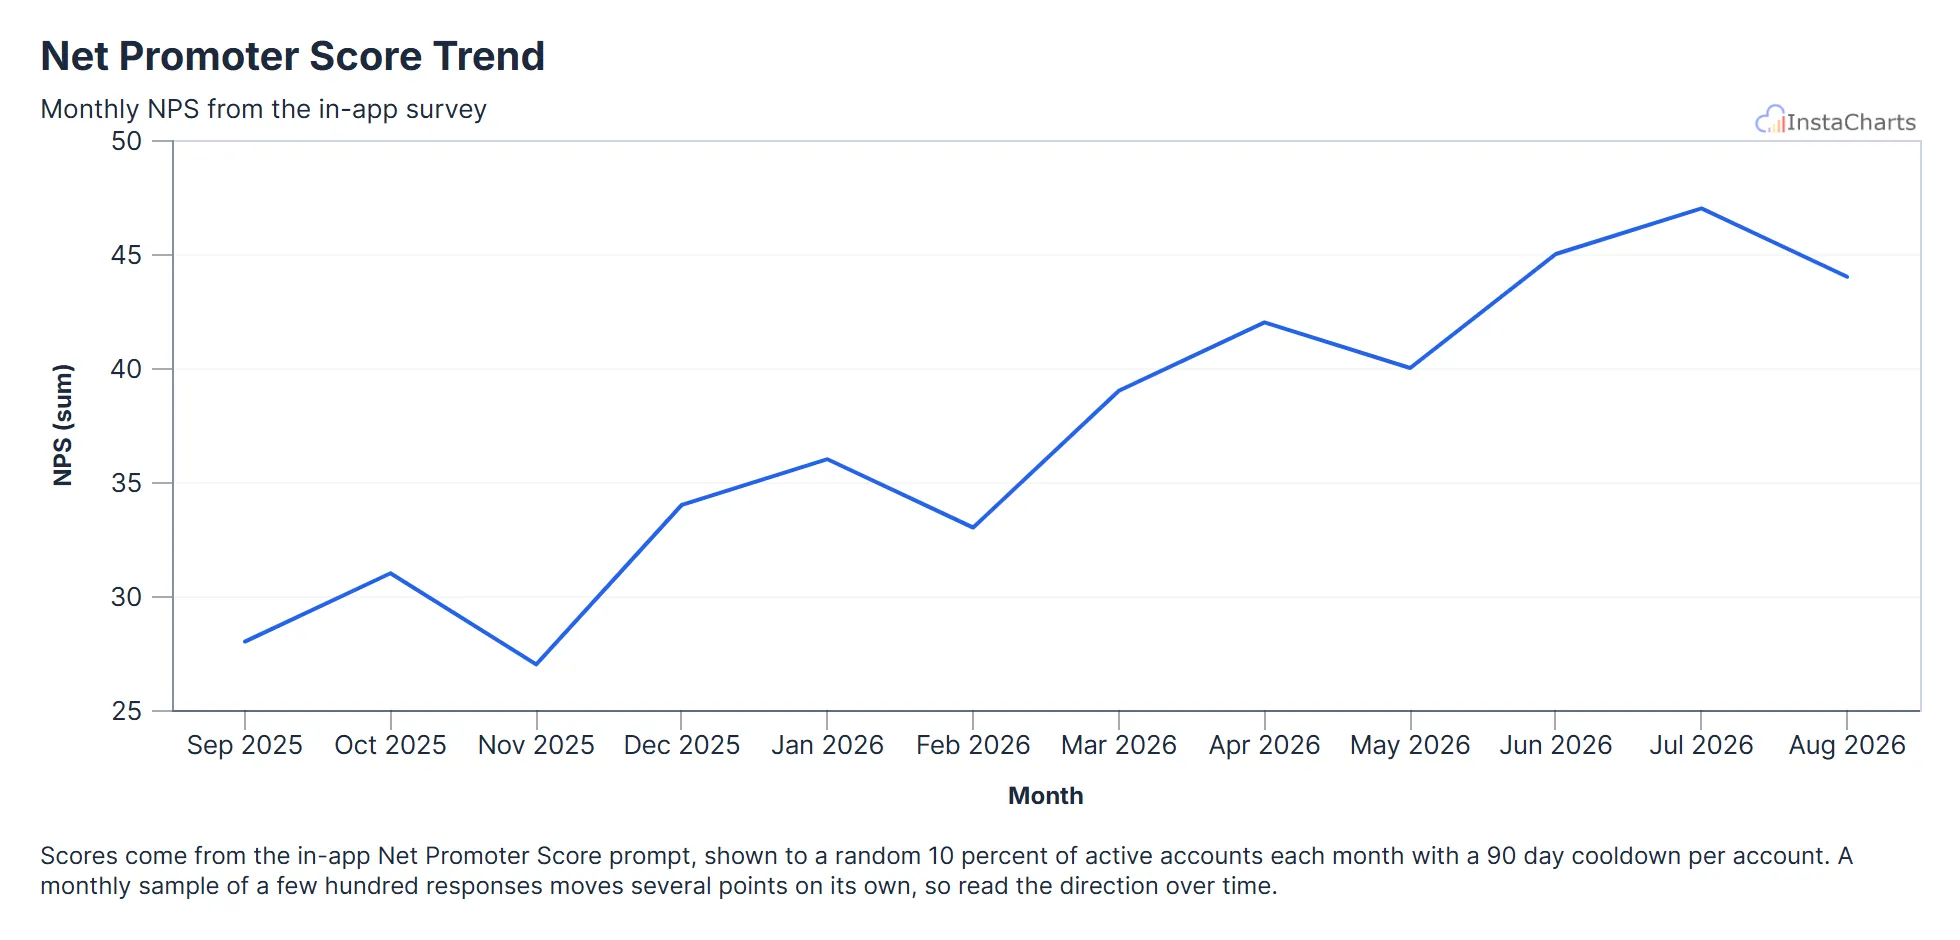 Line Chart
Net Promoter Score Trend
Net Promoter Score from the in-app survey for each month over the last year.
View template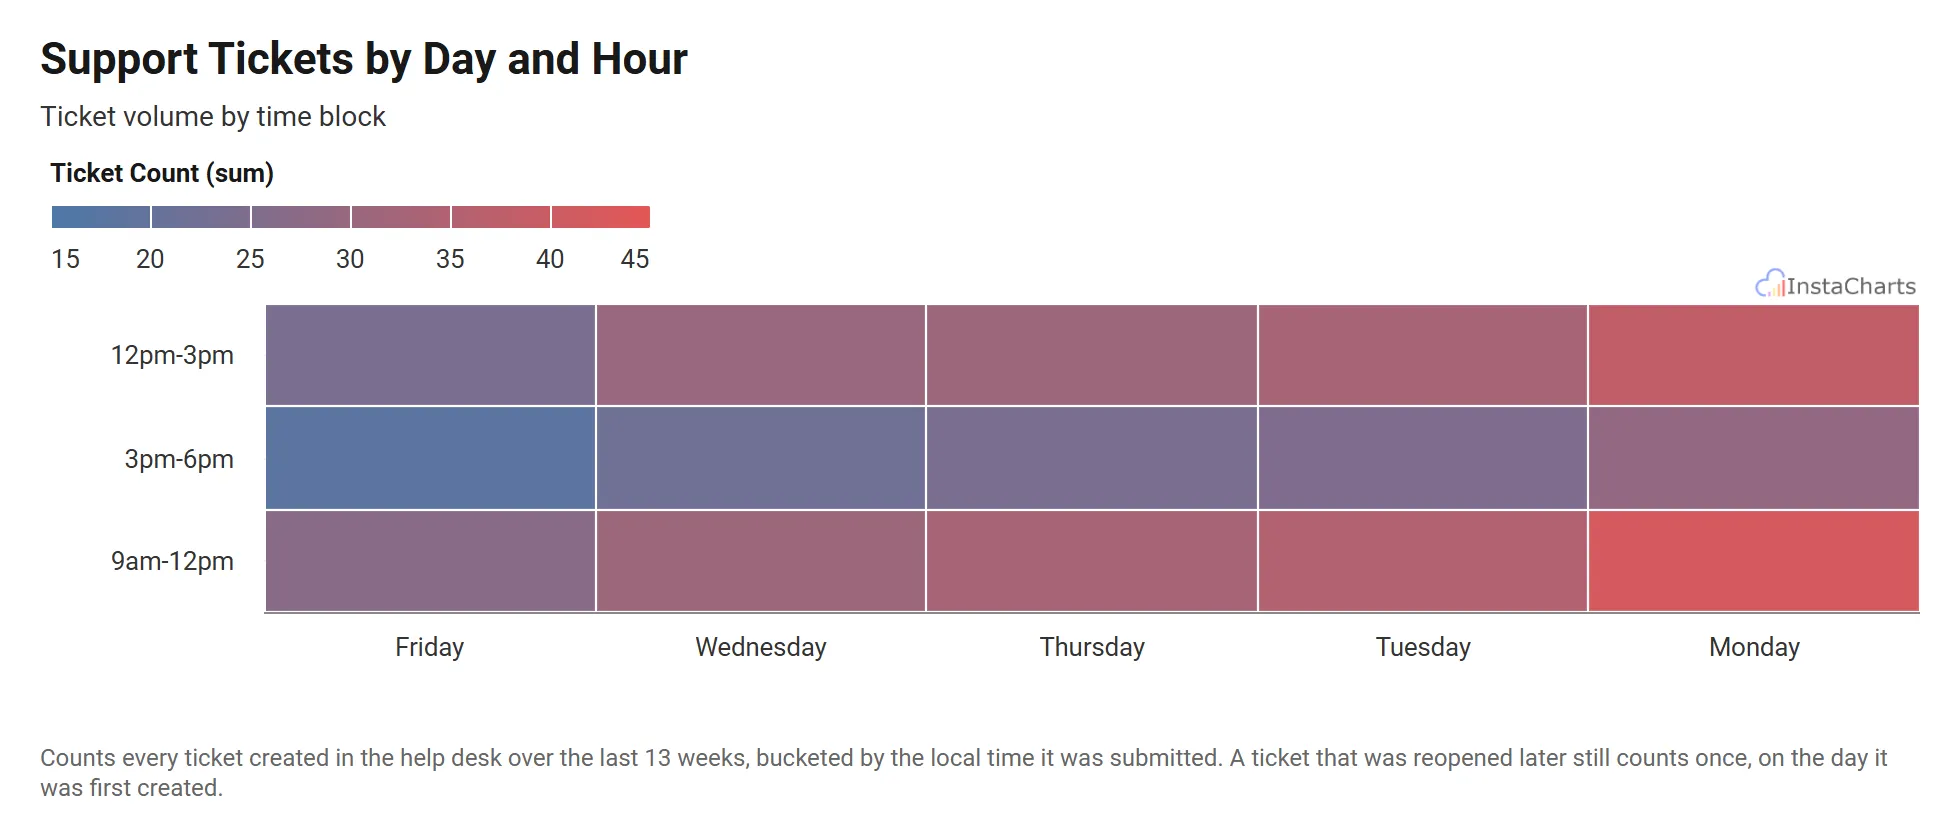 Heatmap
Support Tickets by Day and Hour
Customer support ticket volume by day of the week and time block.
View template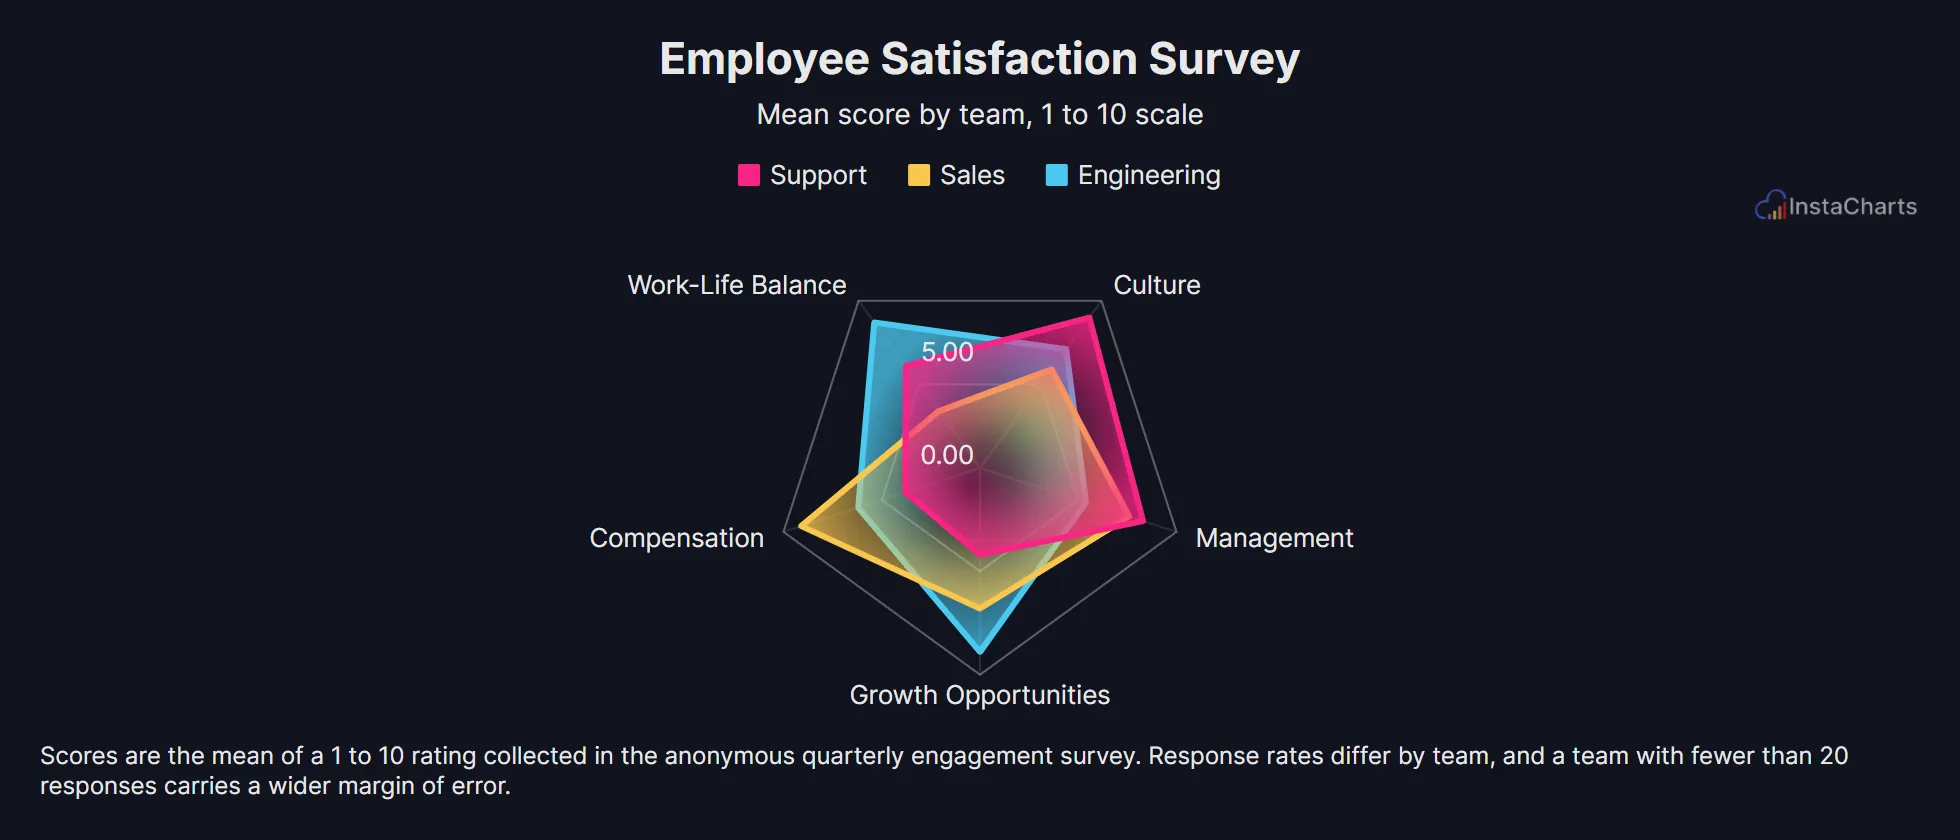 Radar Chart
Employee Satisfaction Survey
Survey scores across compensation, work-life balance, management, growth and culture for three teams.
View template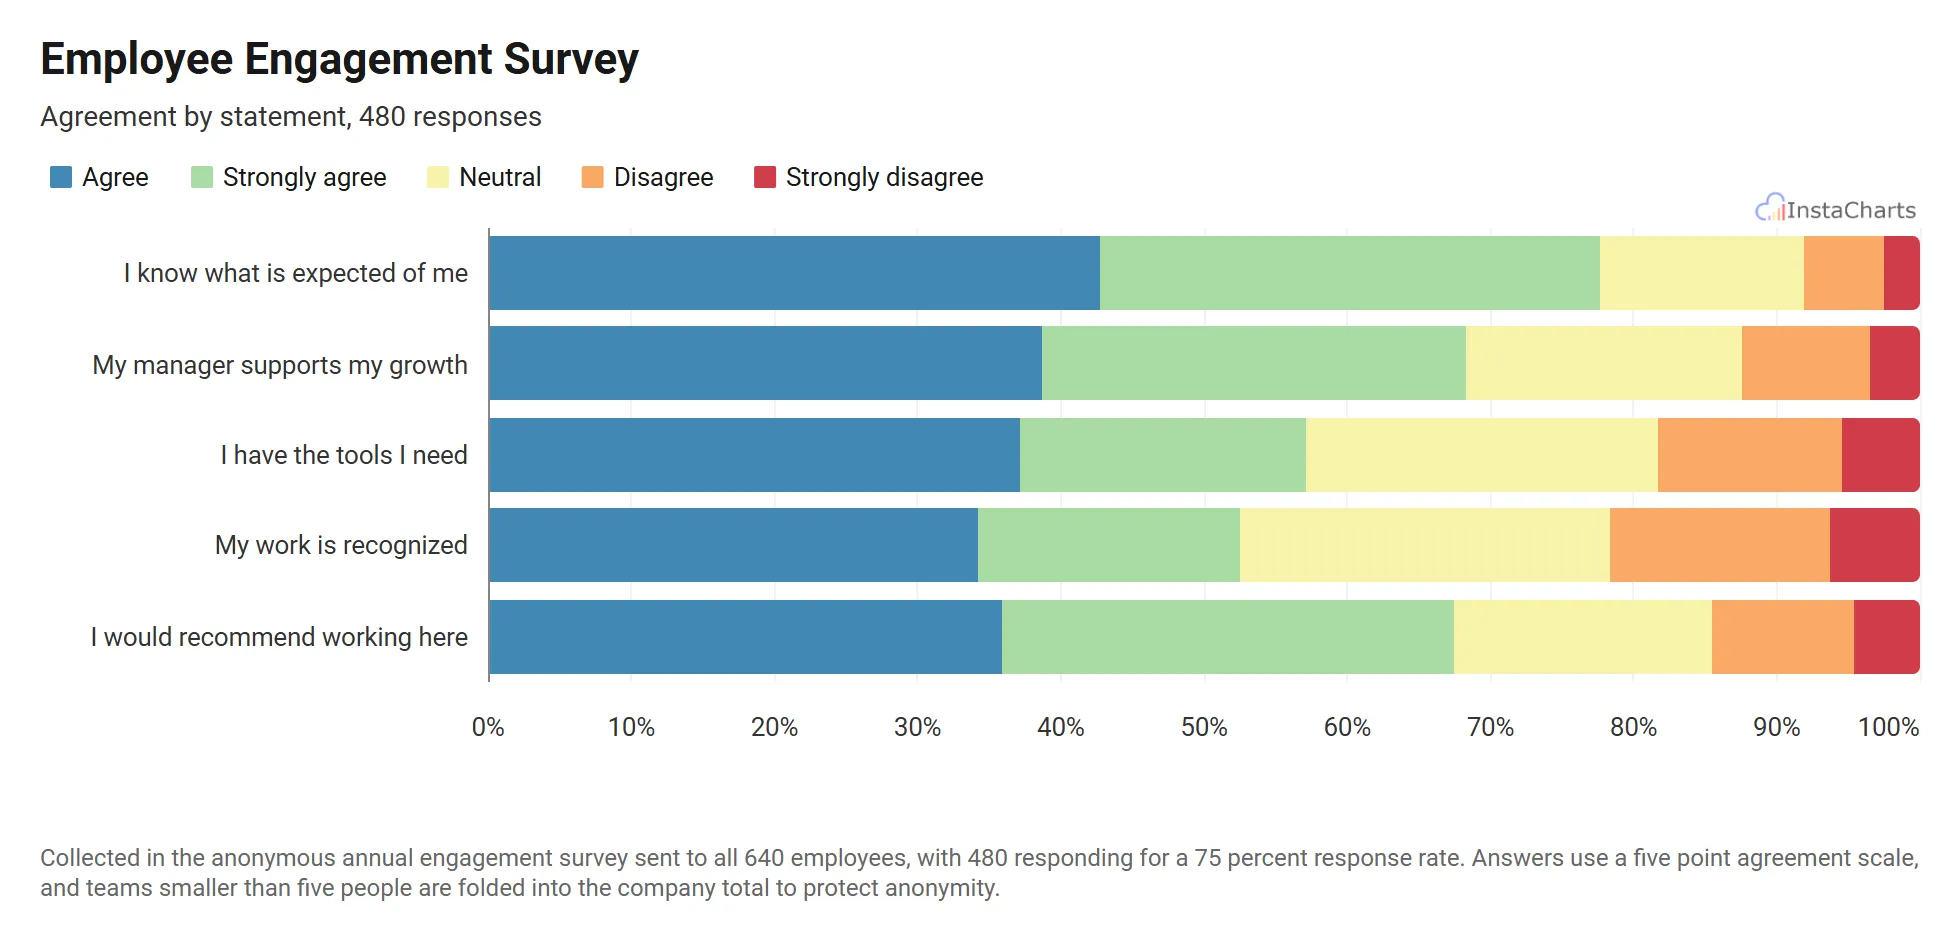 100% Stacked Bar Chart
Employee Engagement Survey
Agreement levels for five engagement statements, stacked into horizontal bars so each question reads as one row.
View templateSee all Customer Experience Chart Templates, or browse all chart templates.
Make your own grouped gauge chart in seconds
InstaCharts makes data visualization easy, so you can build clear reports without design experience.