
Sales templates
Sales Chart Templates
6 free templates you can edit online
Sales reviews come back to the same questions: how much is in the pipeline, who is closing, and how close the team is to quota. These templates answer each one with a chart that is ready for a forecast call or a board slide.
- 6 templates
- Real sample data
- No account needed
Sales Pipeline by Stage
Sales
Sales Chart Templates
Each template opens in the InstaCharts chart maker with its sample data loaded. Replace the rows with your own numbers, then export, share or embed the chart.
 Horizontal Bar Chart
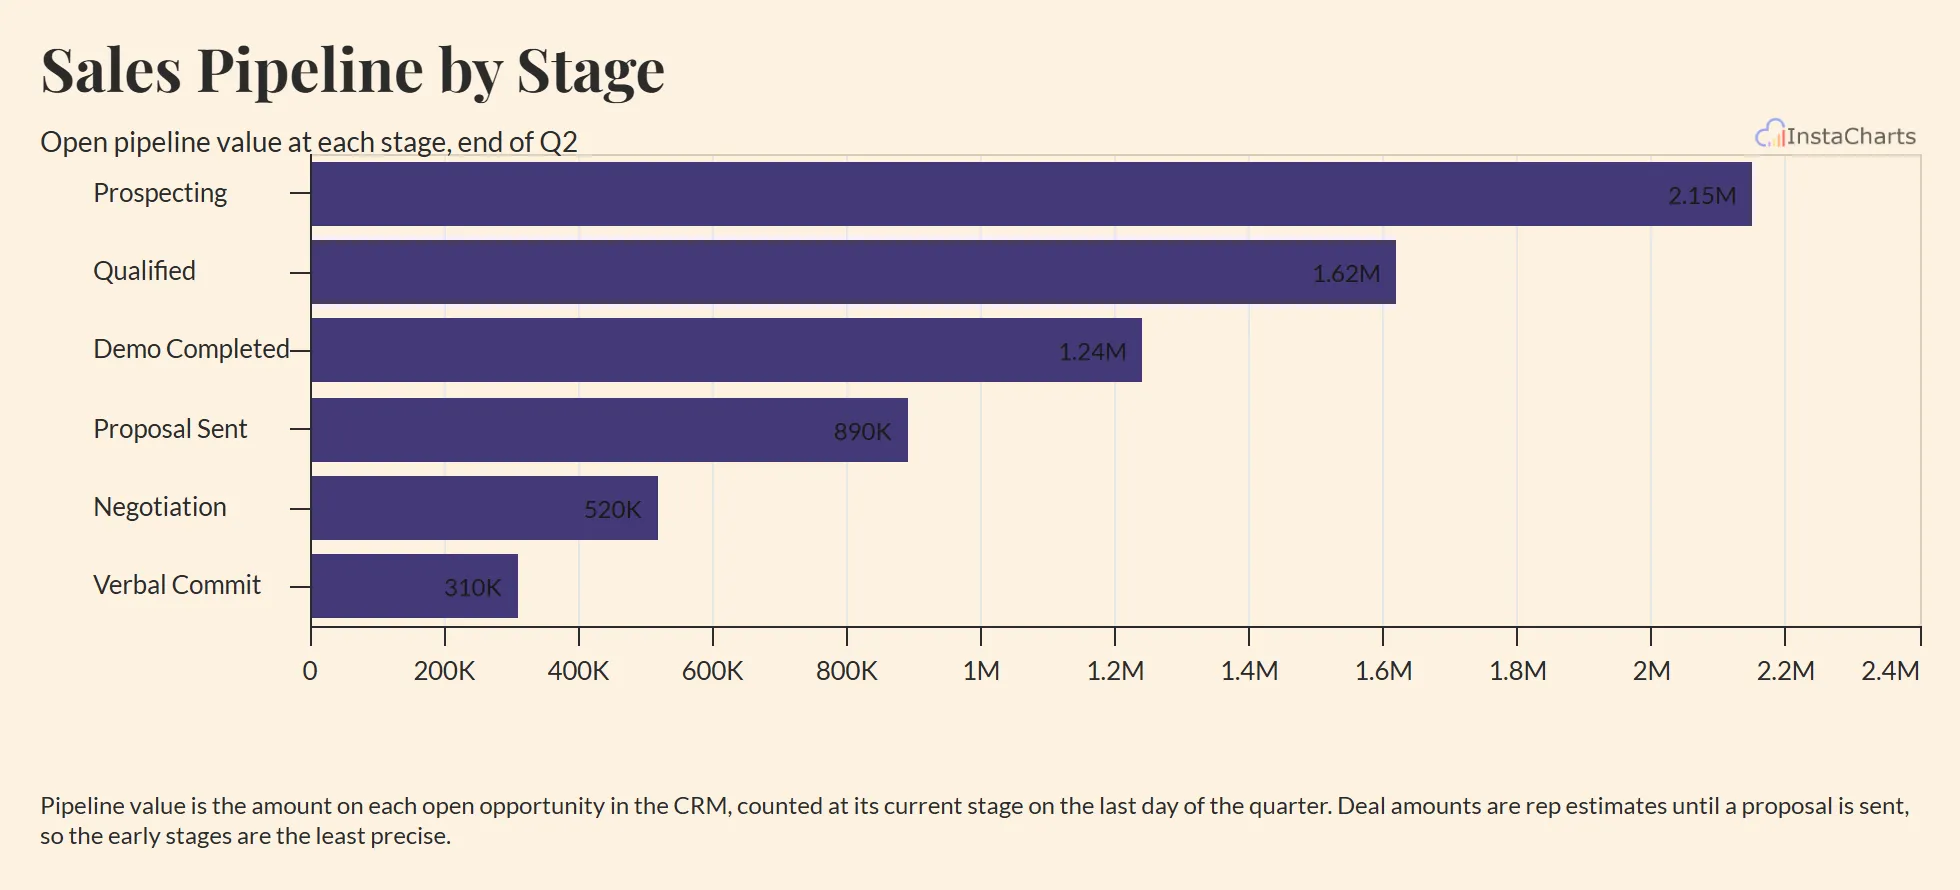
Sales Pipeline by Stage
Open pipeline value at each deal stage, from first contact to verbal commit, drawn as horizontal bars in stage order.
View template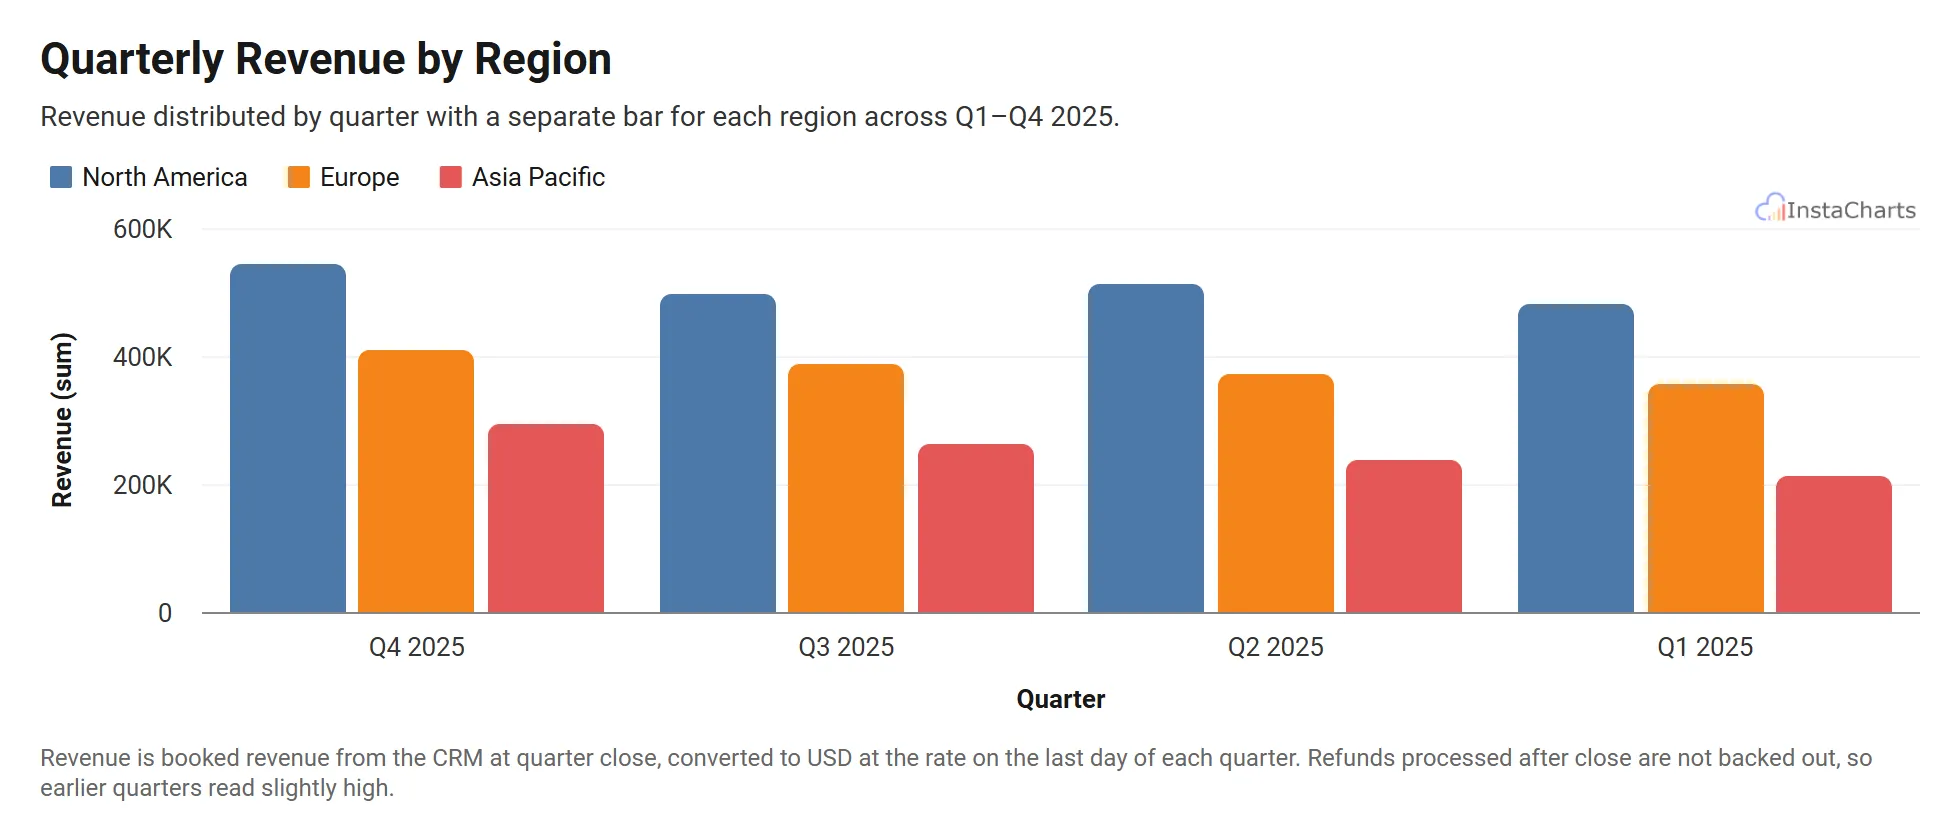 Grouped Bar Chart
Quarterly Revenue by Region
Revenue across North America, Europe and Asia Pacific for four quarters.
View template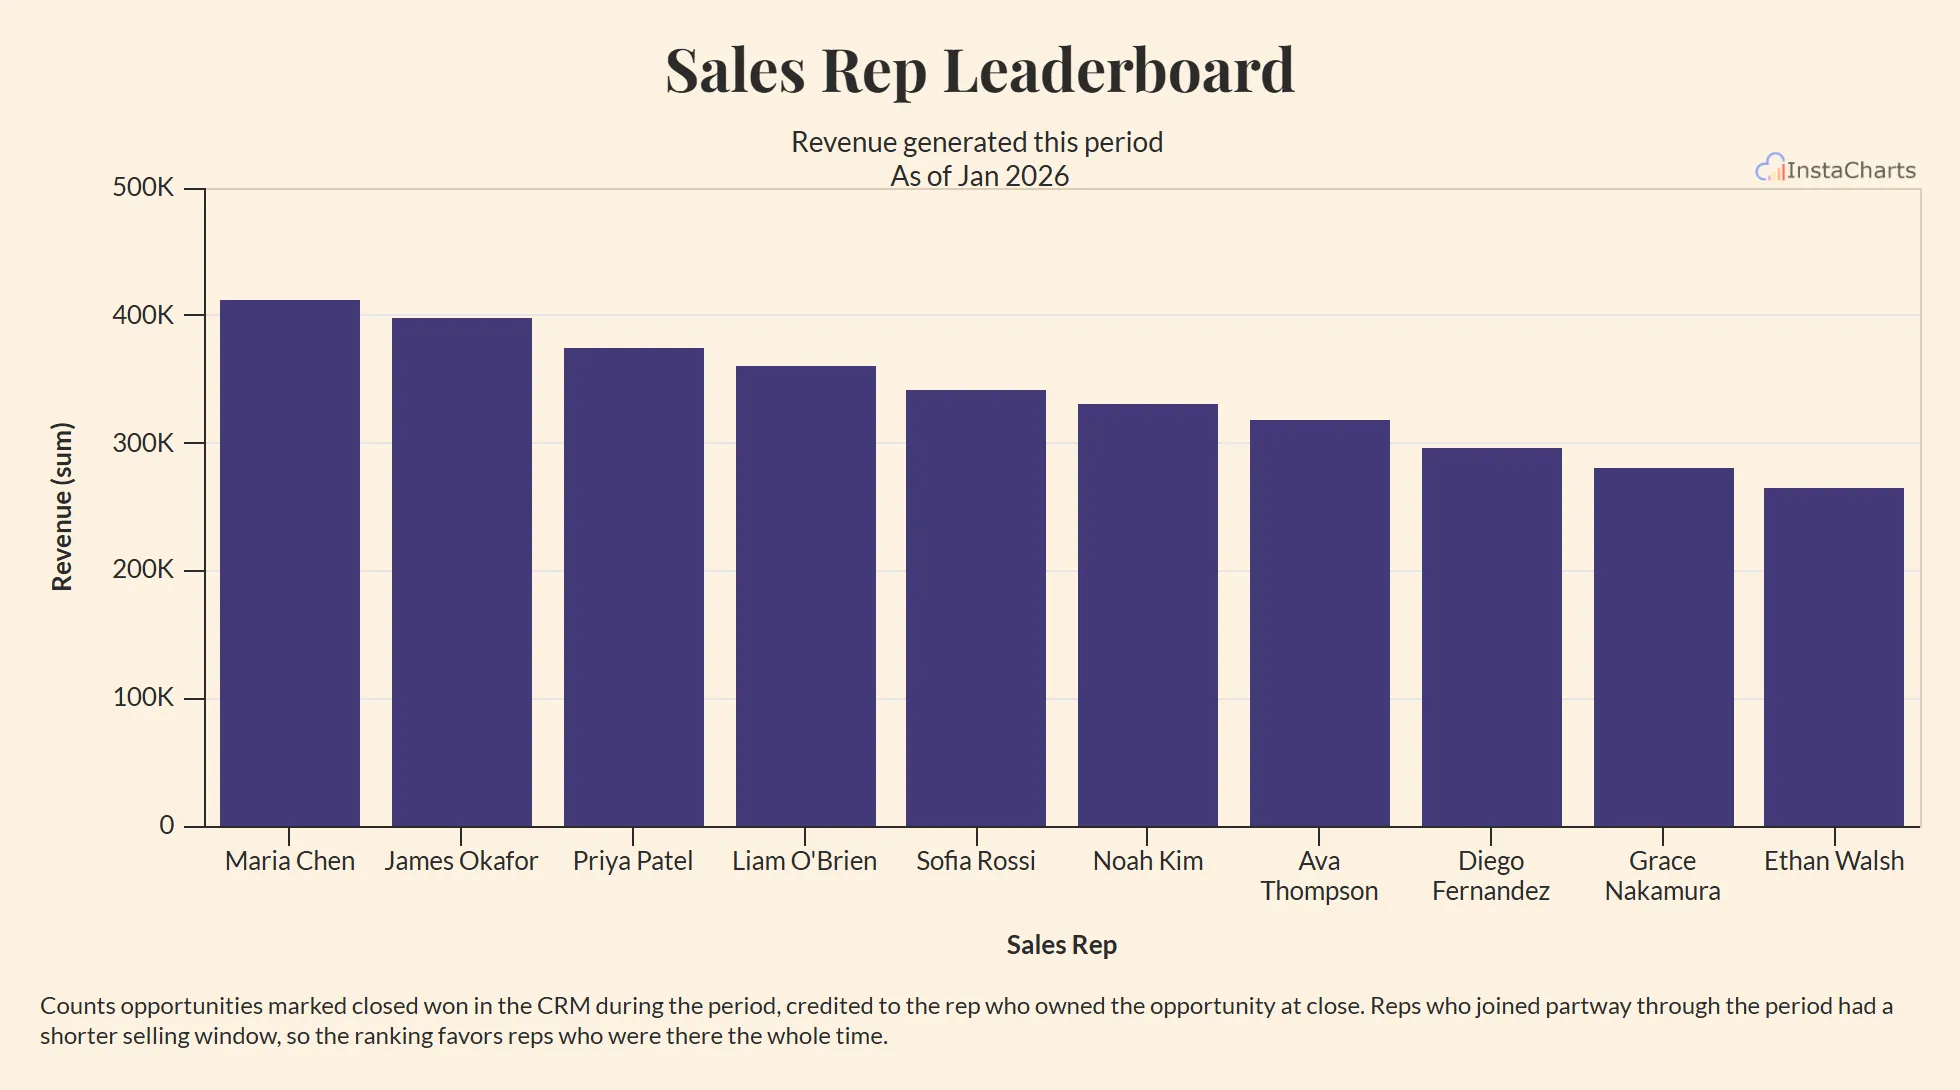 Bar Chart
Sales Rep Leaderboard
Deals closed and revenue generated by each sales representative on the team.
View template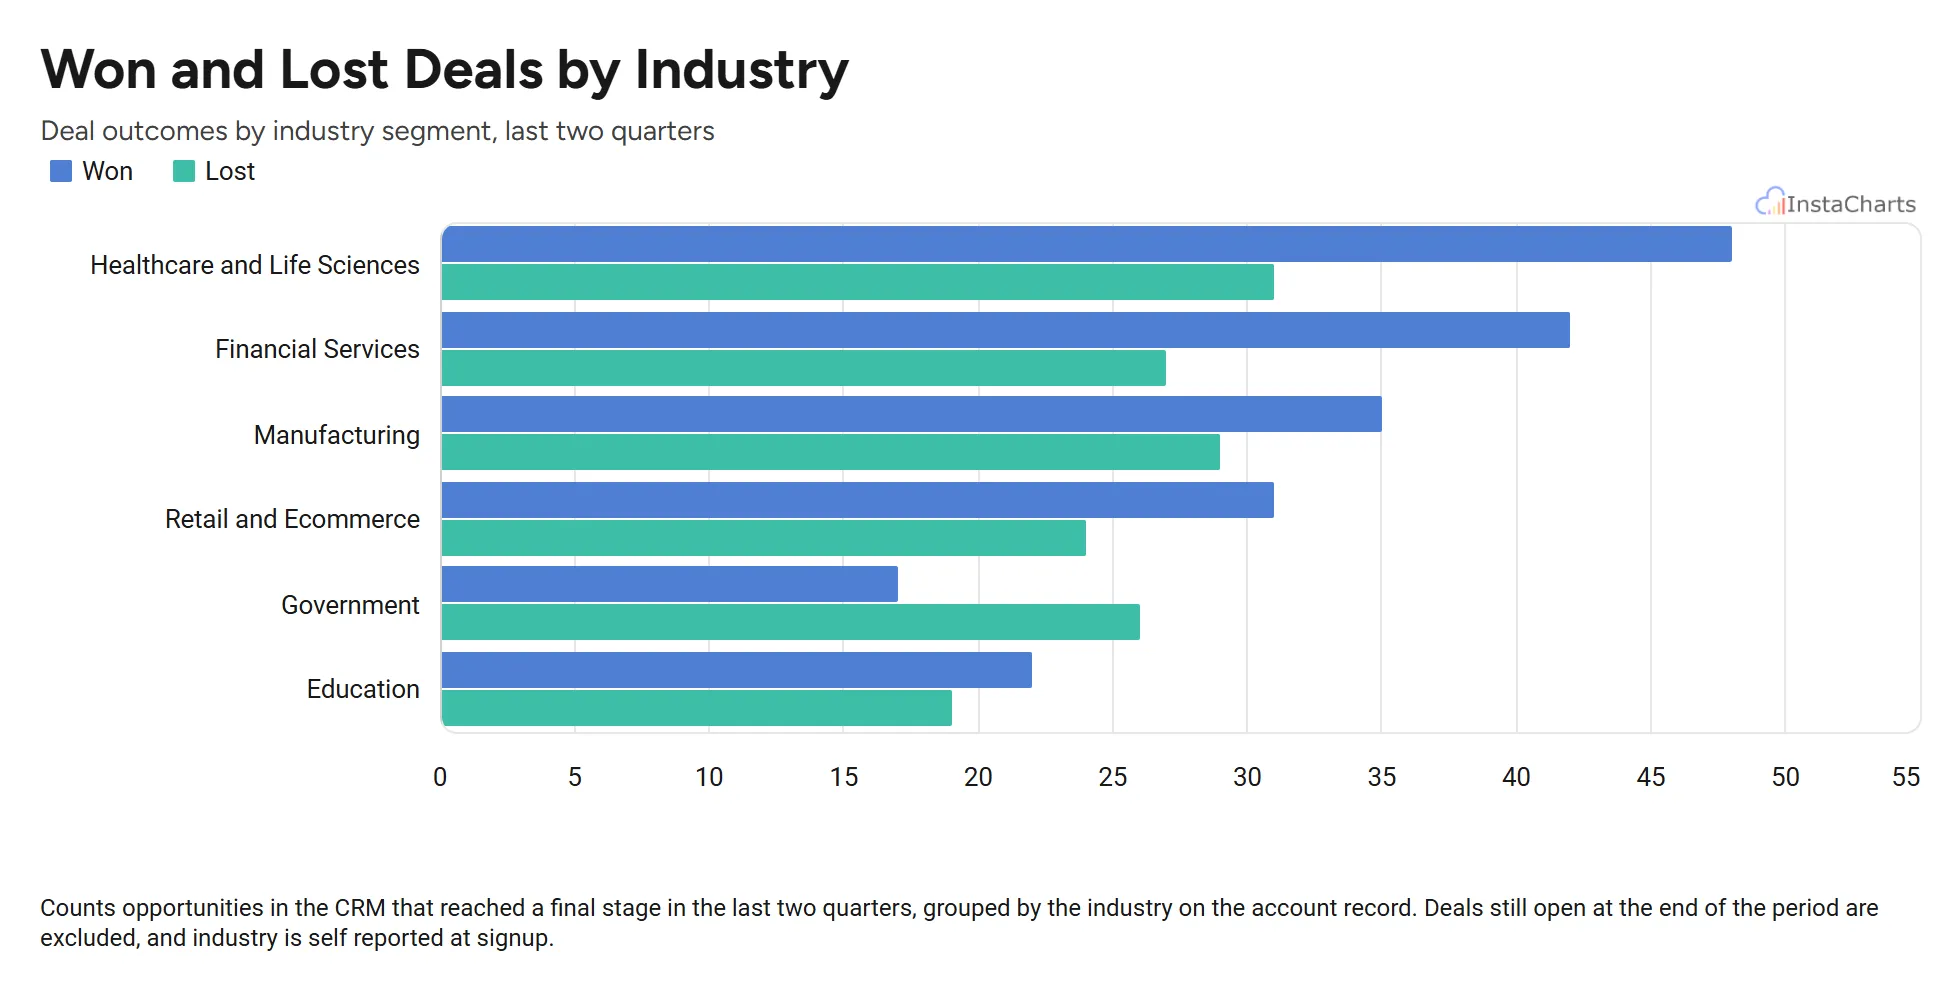 Horizontal Grouped Bar Chart
Won and Lost Deals by Industry
Deals won and deals lost in each industry segment, drawn as horizontal bars so the industry names stay readable.
View template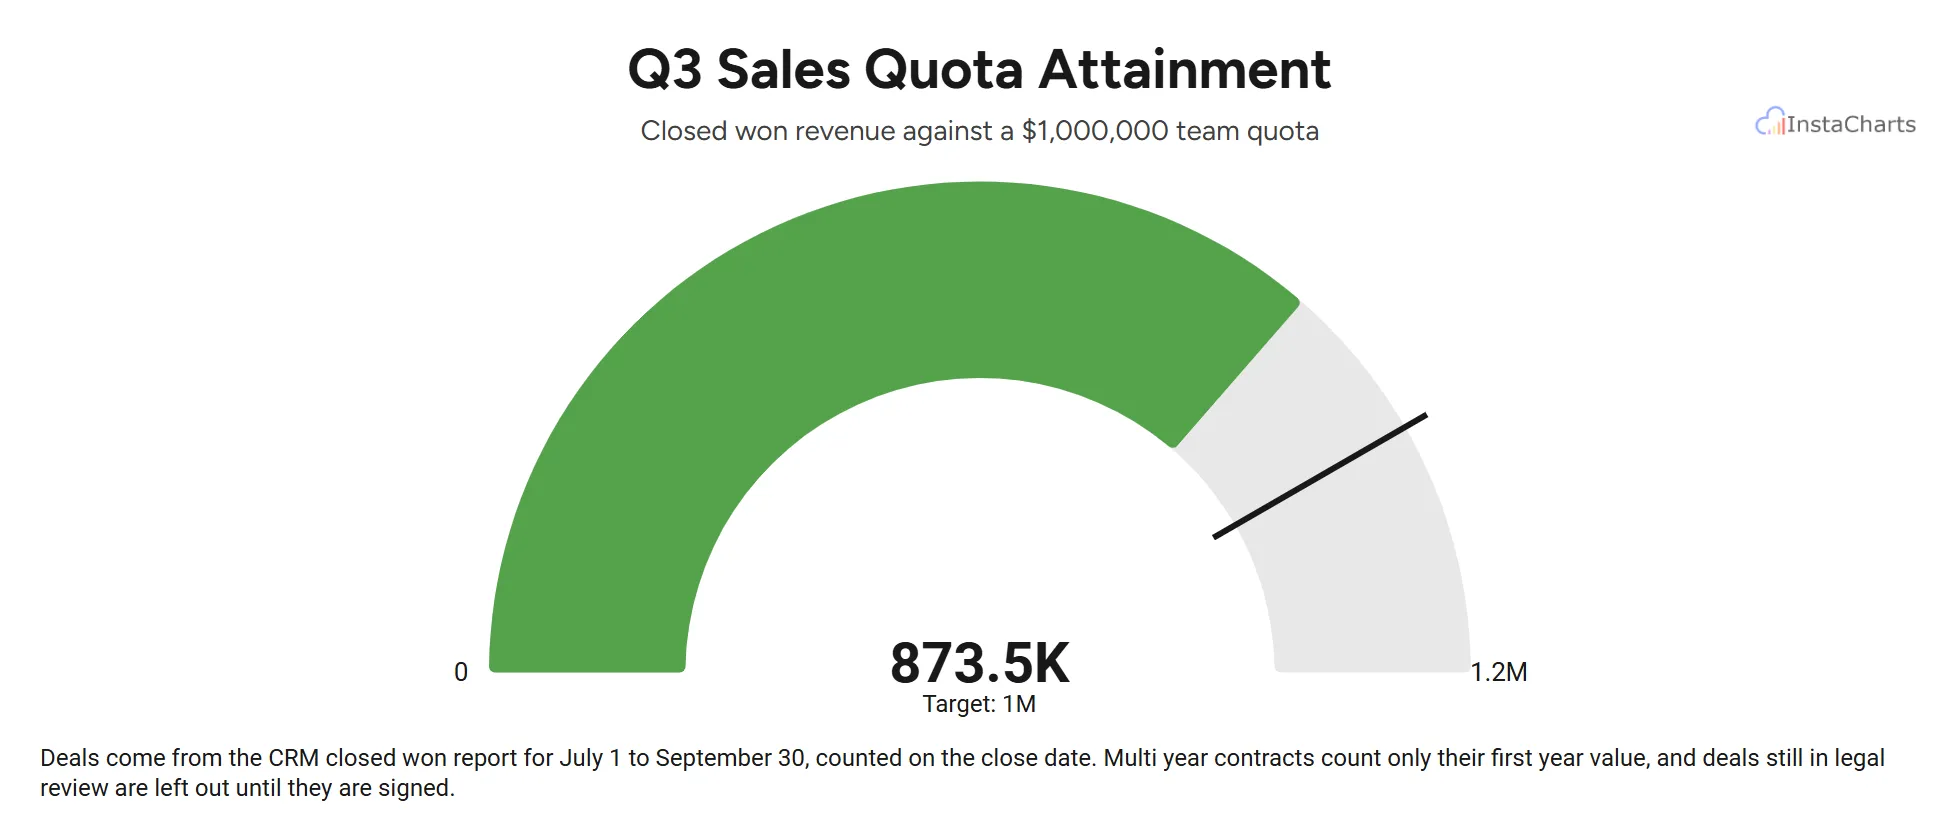 Gauge Chart
Quarterly Sales Goal
Closed won deals for one sales team over a quarter, added up and shown on a gauge against the team quota.
View template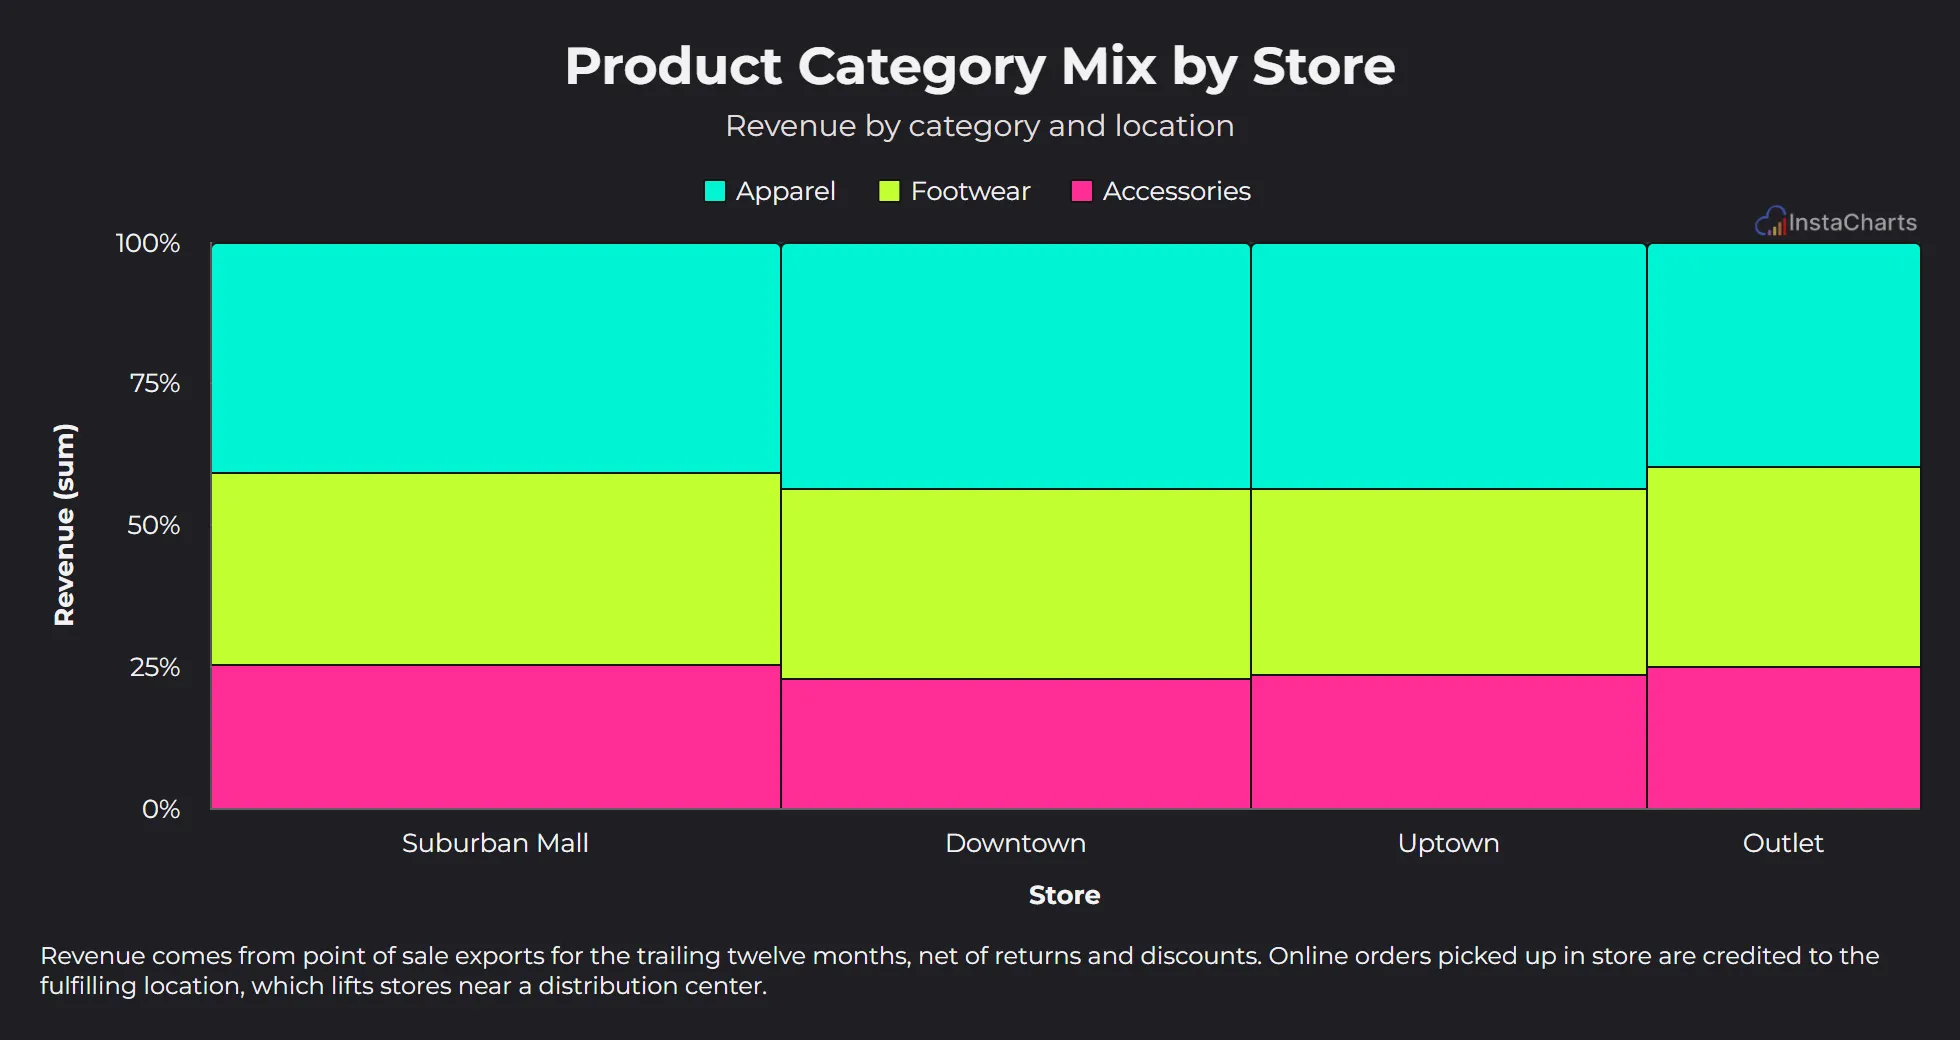 Mekko Chart
Product Category Mix by Store
Revenue by product category for each retail store location.
View templateTemplates for other industries
Craft professional charts in seconds
InstaCharts makes data visualization easy, so you can build clear reports without design experience.