
Page Load Time vs Bounce Rate Chart Template
Page load time and bounce rate samples across different page types on a website.
Show how bounce rate rises as pages load more slowly. The template plots 16 samples across four page types, colored by type, with a dashed best fit line.
- 16 sample rows
- 3 columns
- Export, share or embed
Page Load Time vs Bounce Rate
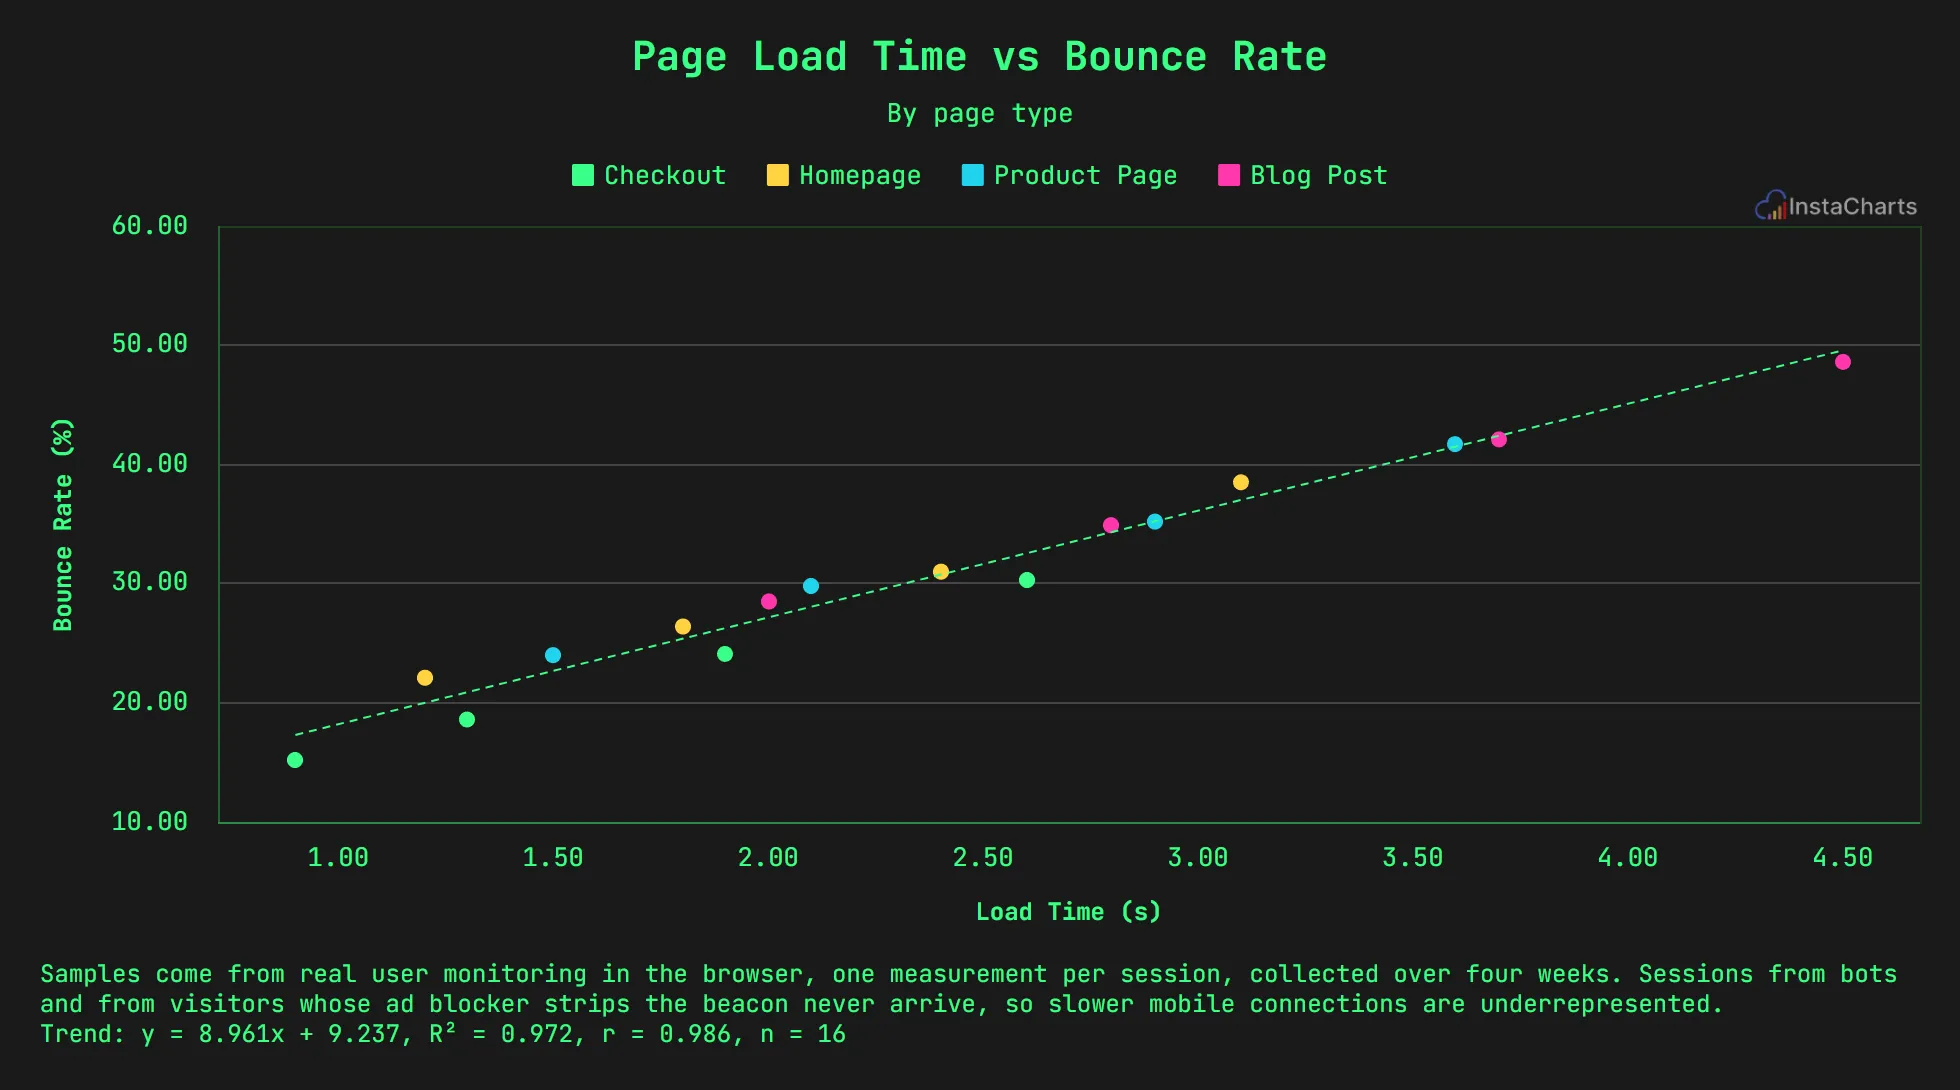
A live grouped scatter plot drawn from the sample data below. Click Edit this template to change it.
About this template
What the page load time vs bounce rate chart shows
Every page type in the sample bounces more as load time grows. Checkout pages load fastest, with a 15.2% bounce rate at 0.9 seconds, and blog posts reach 48.6% at 4.5 seconds.
The trend line summarizes the relationship across all page types, and the colors show that each type follows the same pattern.
About the sample data
Samples come from real user monitoring in the browser, one measurement per session, collected over four weeks. Sessions from bots and from visitors whose ad blocker strips the beacon never arrive, so slower mobile connections are underrepresented.
Sample data
Sample data for the page load time vs bounce rate template
The template loads these 16 rows. Keep the same columns, replace the rows with your own numbers, and the grouped scatter plot redraws to match.
Page Type
Dot color, one per value
Load Time (s)
X axis
Bounce Rate (%)
Y axis
| Page Type | Load Time (s) | Bounce Rate (%) |
|---|---|---|
| Homepage | 1.2 | 22.1 |
| Homepage | 1.8 | 26.4 |
| Homepage | 2.4 | 31 |
| Homepage | 3.1 | 38.5 |
| Product Page | 1.5 | 24 |
| Product Page | 2.1 | 29.8 |
| Product Page | 2.9 | 35.2 |
| Product Page | 3.6 | 41.7 |
| Checkout | 0.9 | 15.2 |
| Checkout | 1.3 | 18.6 |
| Checkout | 1.9 | 24.1 |
| Checkout | 2.6 | 30.3 |
| Blog Post | 2 | 28.5 |
| Blog Post | 2.8 | 34.9 |
| Blog Post | 3.7 | 42.1 |
| Blog Post | 4.5 | 48.6 |
How to use it
How to adapt the page load time vs bounce rate template
- 1 Click Edit this template to open the chart and its sample data in the InstaCharts chart maker. No account is needed.
- 2 Use one row per sample with the page type, load time and bounce rate.
- 3 Use real user monitoring data when you can, since lab tests can miss slow connections.
- 4 Keep load time on the x axis so the chart reads as cause on the left and effect going up.
- 5 Remove the trend line in the chart options when you only want the raw points.
- 6 Download the chart as a PNG, SVG or PDF, share it with a link, or embed it on a website. Sign up free to save it.
FAQ
Page Load Time vs Bounce Rate template FAQ
How do I add a trend line to a scatter plot?
Open the trend lines settings and add a linear best fit line. The template already includes one, drawn as a dashed line.
Can I use this template for other web metrics?
Yes. Replace the columns with any two measures, such as time on page and conversion rate, and keep a category column for the colors.
Is this chart template free?
Yes. Click Edit this template to open it in the InstaCharts chart maker with no account needed. Sign up free to save the chart, share it with a link or embed it on a website.
How do I use my own data with this template?
Open the template in the chart maker, then paste in your own spreadsheet or upload a CSV or Excel file with the same kind of columns. The new chart keeps this template's grouped scatter plot type, and you can pick which columns go on each axis.
Learn more about this chart type on the grouped scatter plot maker page.
More templates
Related chart templates
 Donut Chart
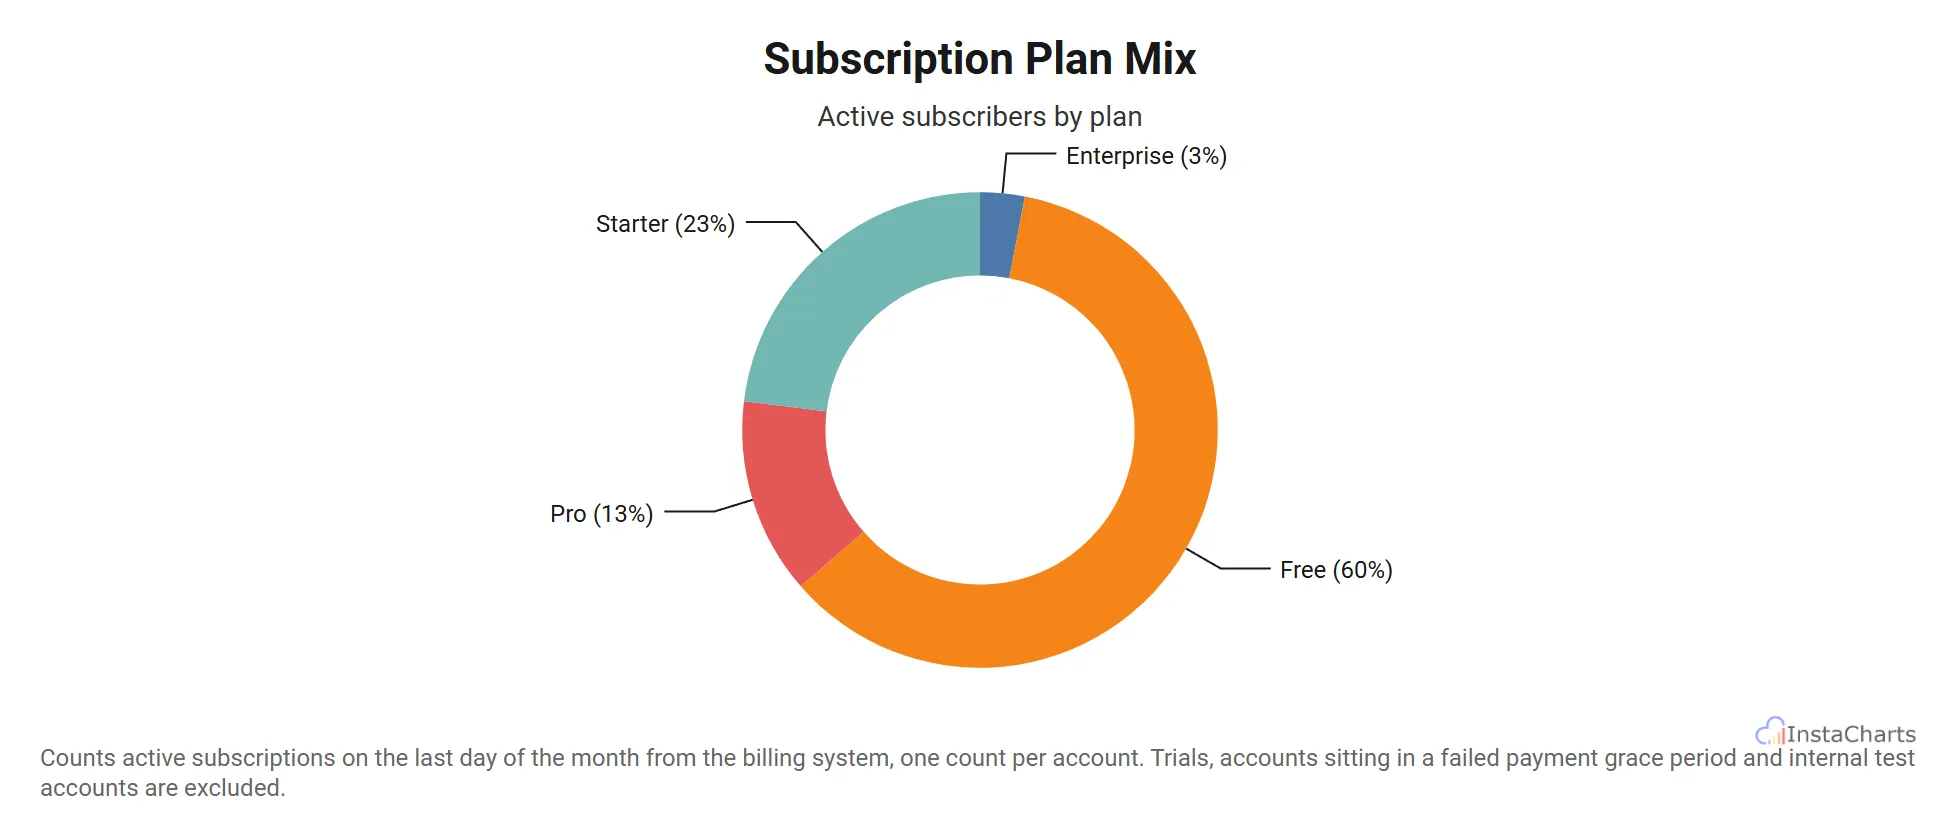
Subscription Plan Mix
Active subscriber counts across four pricing tiers, from free to enterprise, shown as a donut.
View template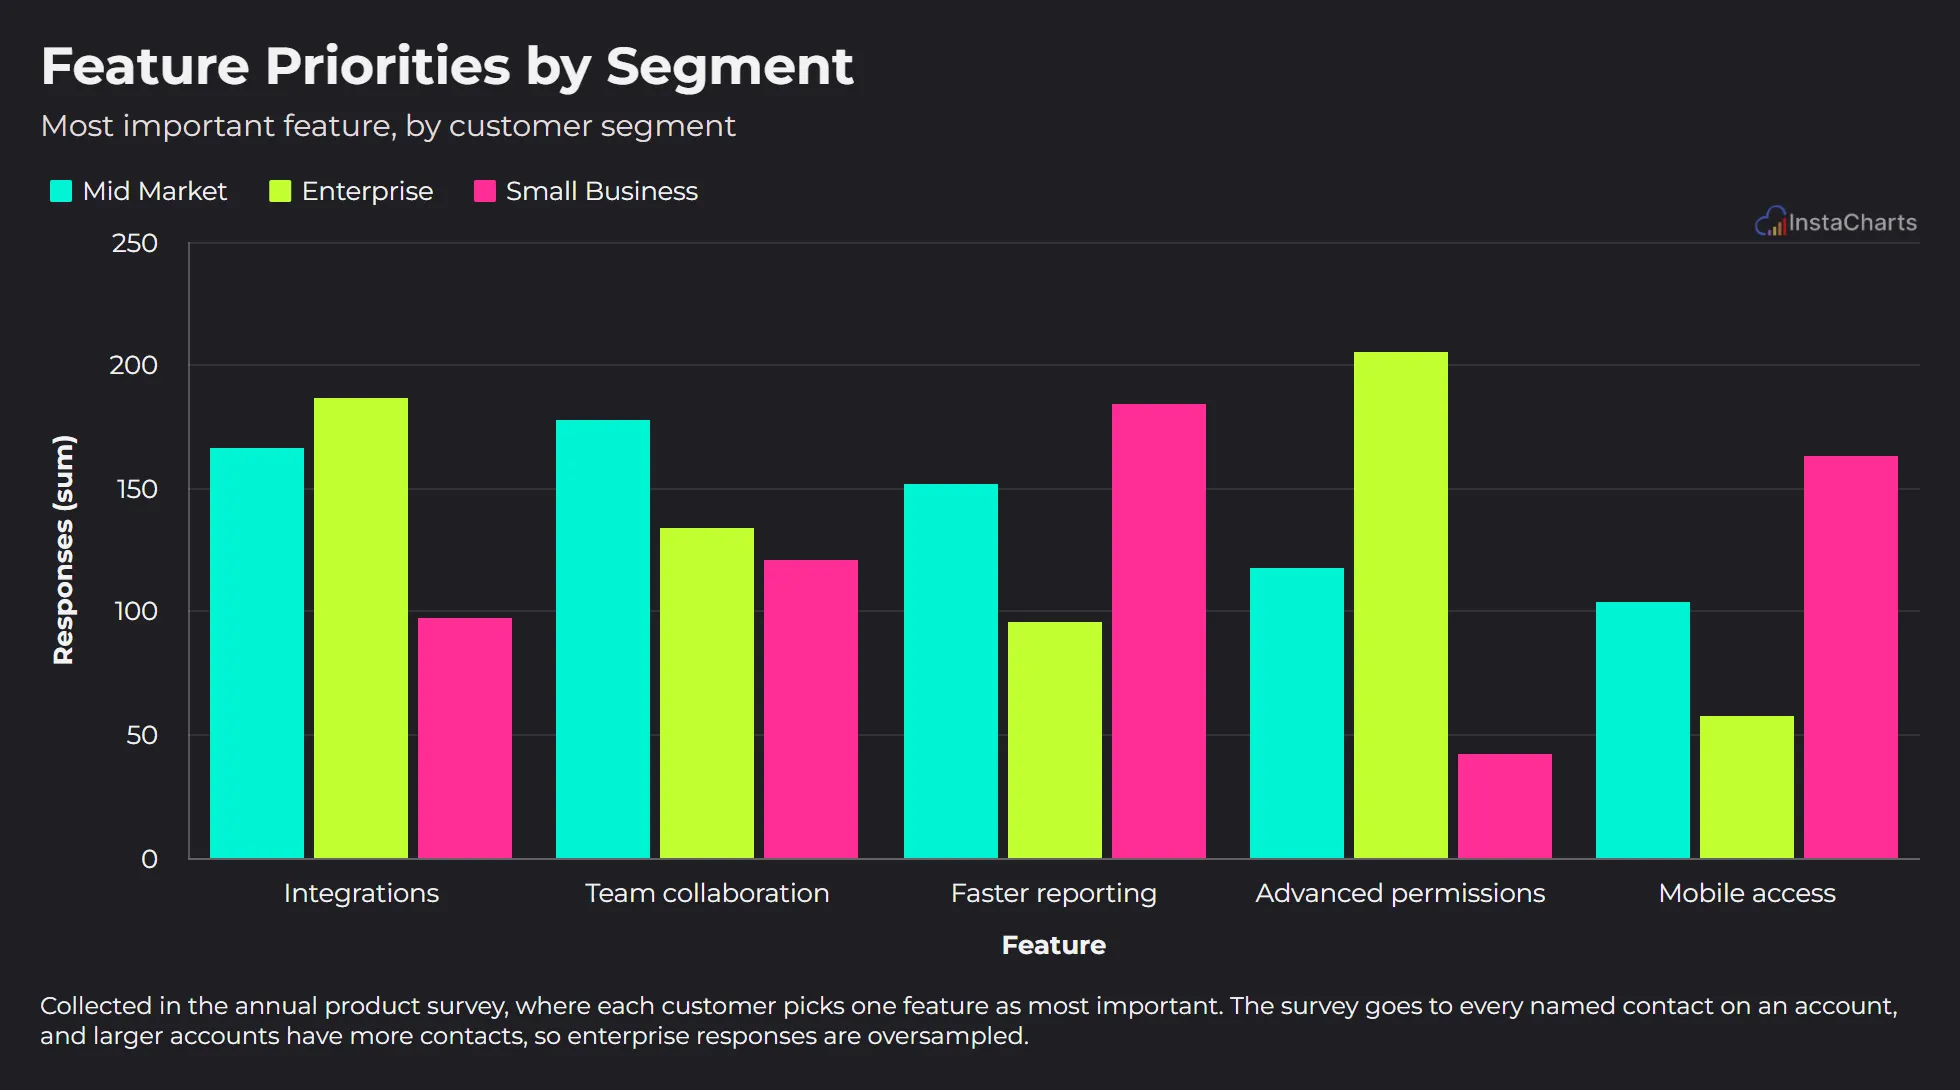 Grouped Bar Chart
Feature Priorities by Segment
The feature each customer segment picked as most important in the annual product survey.
View template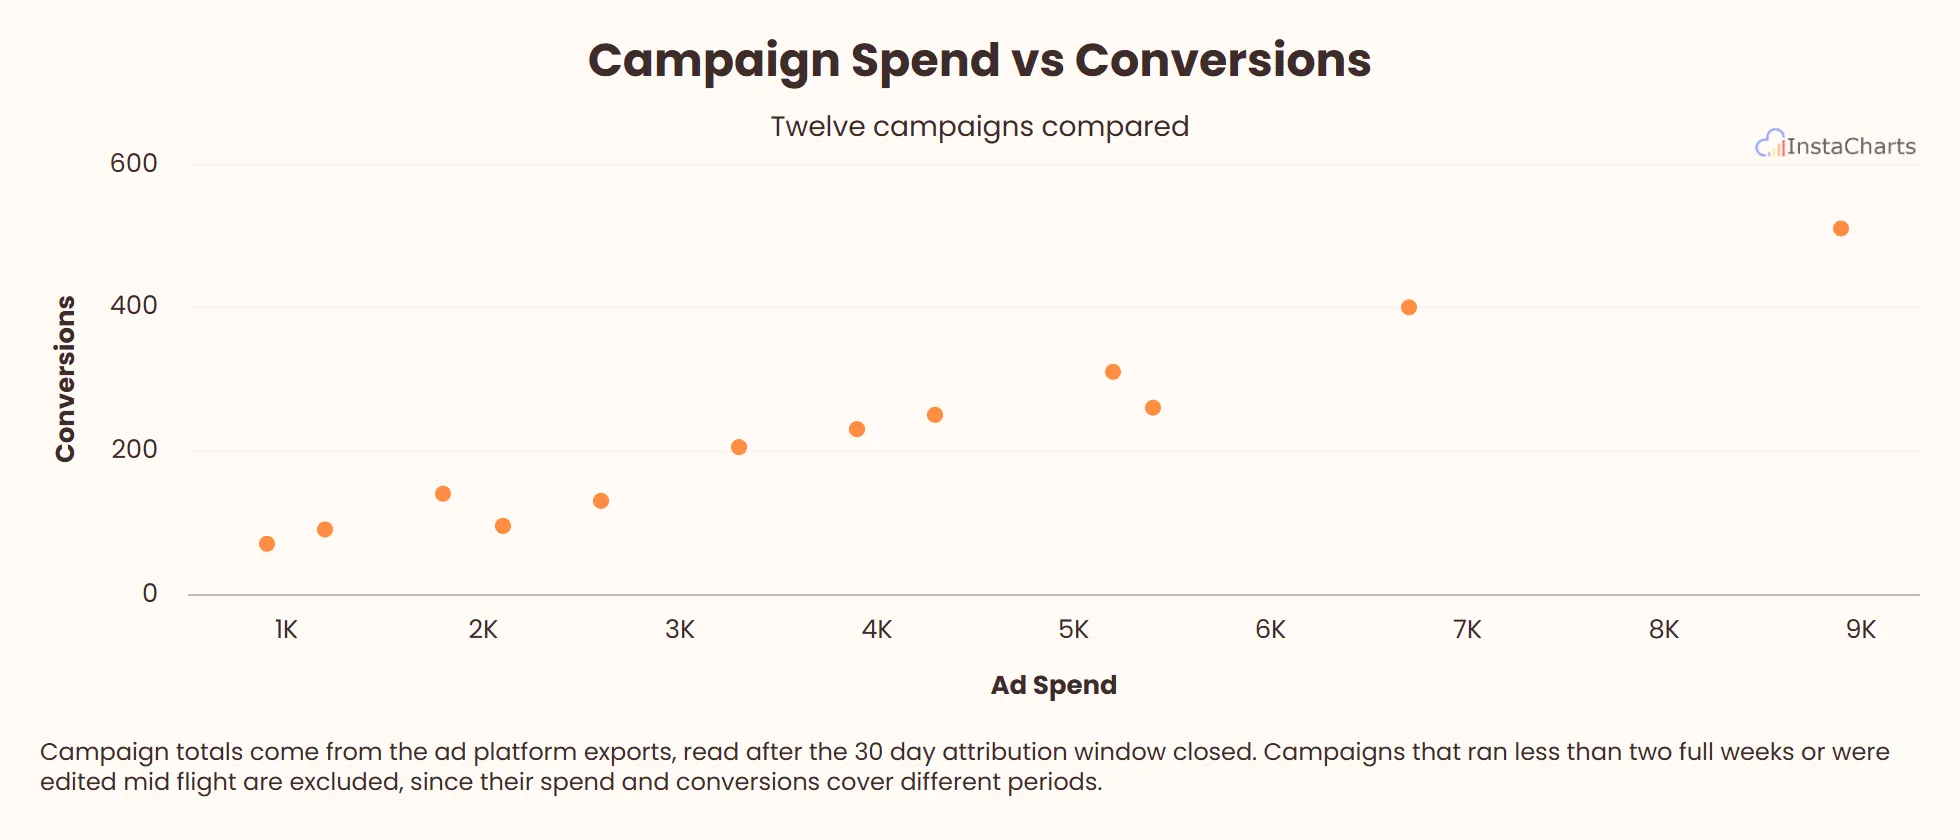 Scatter Plot
Campaign Spend vs Conversions
Ad spend and conversions for twelve marketing campaigns, useful for spotting which campaigns return the most value.
View template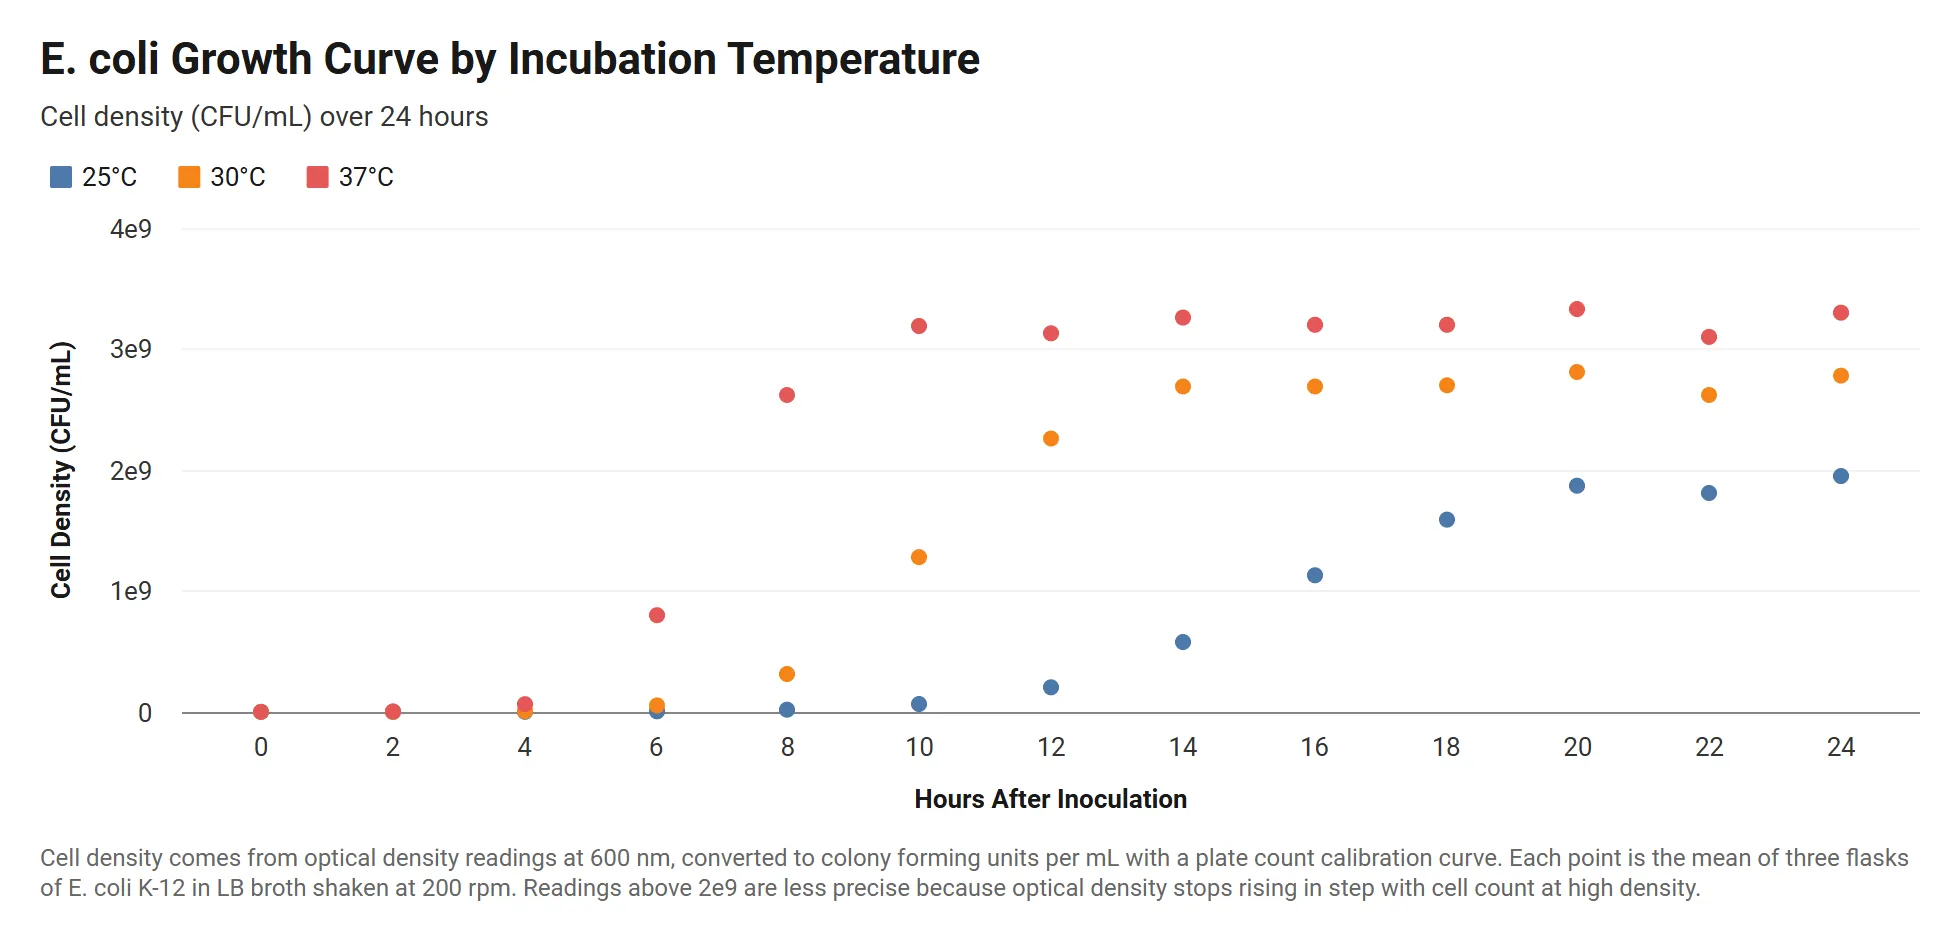 Grouped Scatter Plot
Bacterial Growth Curve by Temperature
E. coli cell density over 24 hours at three incubation temperatures, with readings written in scientific notation.
View templateSee all SaaS and Product Chart Templates, or browse all chart templates.
Make your own grouped scatter plot in seconds
InstaCharts makes data visualization easy, so you can build clear reports without design experience.