
Stock Price Chart Template
Daily closing price for a sample stock ticker over several weeks of trading.
Plot daily closing prices for a stock or fund on a clean line chart. The template covers 21 trading sessions and skips weekends and market holidays.
- 21 sample rows
- 2 columns
- Export, share or embed
Stock Price Trend
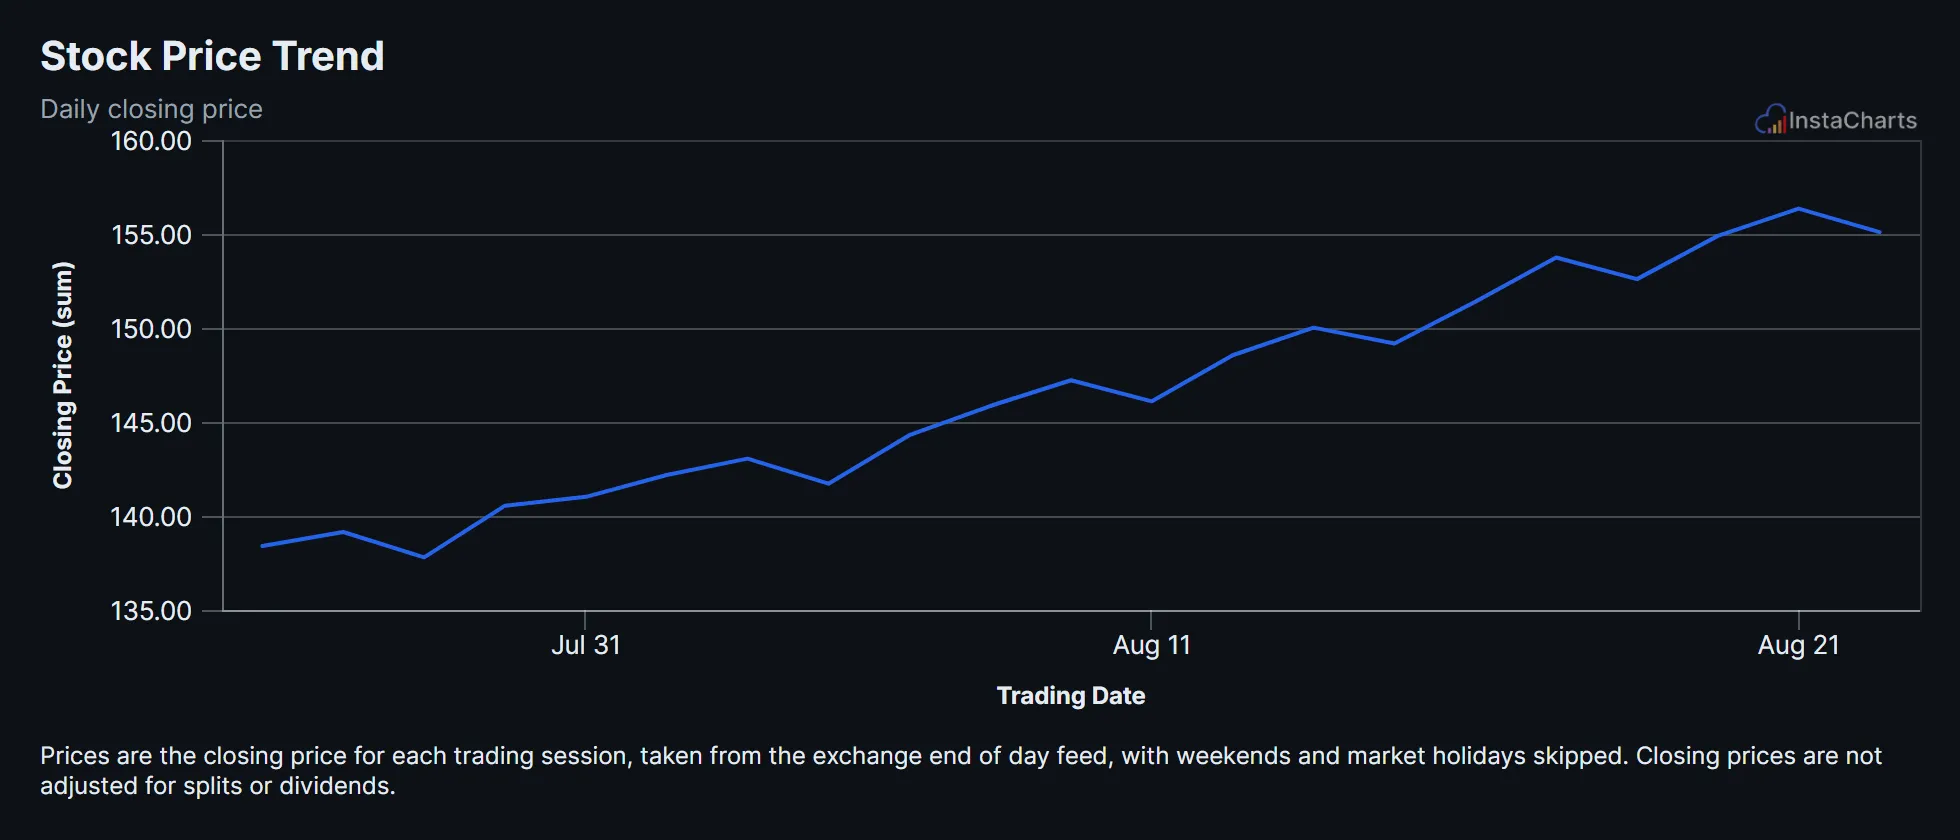
A live line chart drawn from the sample data below. Click Edit this template to change it.
About this template
What the stock price trend chart shows
The sample price rises from $138.40 on July 27 to $155.10 on August 24, a gain of about 12% over the period. Small pullbacks along the way, such as August 5 and August 11, show up as short dips in the line.
A line chart with one point per trading day is the standard way to show a price trend, and it works for funds, indexes and currencies too.
About the sample data
Prices are the closing price for each trading session, taken from the exchange end of day feed, with weekends and market holidays skipped. Closing prices are not adjusted for splits or dividends.
Sample data
Sample data for the stock price trend template
The template loads these 21 rows. Keep the same columns, replace the rows with your own numbers, and the line chart redraws to match.
Trading Date
Time axis
Closing Price
Values
| Trading Date | Closing Price |
|---|---|
| 2026-07-27 | 138.4 |
| 2026-07-28 | 139.15 |
| 2026-07-29 | 137.8 |
| 2026-07-30 | 140.55 |
| 2026-07-31 | 141.02 |
| 2026-08-03 | 142.18 |
| 2026-08-04 | 143.05 |
| 2026-08-05 | 141.72 |
| 2026-08-06 | 144.3 |
| 2026-08-07 | 145.85 |
| 2026-08-10 | 147.22 |
| 2026-08-11 | 146.1 |
| 2026-08-12 | 148.55 |
| 2026-08-13 | 150.02 |
| 2026-08-14 | 149.18 |
| 2026-08-17 | 151.4 |
| 2026-08-18 | 153.75 |
| 2026-08-19 | 152.6 |
| 2026-08-20 | 154.9 |
| 2026-08-21 | 156.35 |
| 2026-08-24 | 155.1 |
How to use it
How to adapt the stock price trend template
- 1 Click Edit this template to open the chart and its sample data in the InstaCharts chart maker. No account is needed.
- 2 Use one row per trading day with the date and the closing price.
- 3 Leave weekends and holidays out of the data. The chart only plots the days you include.
- 4 Add a Ticker column and switch to a grouped line chart to compare several stocks.
- 5 Add a linear trend line from the chart options to show the overall direction.
- 6 Download the chart as a PNG, SVG or PDF, share it with a link, or embed it on a website. Sign up free to save it.
FAQ
Stock Price Trend template FAQ
Can I compare two stocks on one chart?
Yes. Add a Ticker column with one row per stock per day and switch to a grouped line chart. Each ticker gets its own line.
Can the chart update with new prices?
Connect the chart to a Google Sheet that pulls prices, and InstaCharts syncs the new rows into the chart.
Is this chart template free?
Yes. Click Edit this template to open it in the InstaCharts chart maker with no account needed. Sign up free to save the chart, share it with a link or embed it on a website.
How do I use my own data with this template?
Open the template in the chart maker, then paste in your own spreadsheet or upload a CSV or Excel file with the same kind of columns. The new chart keeps this template's line chart type, and you can pick which columns go on each axis.
Learn more about this chart type on the line graph maker page.
More templates
Related chart templates
 Grouped Area Chart
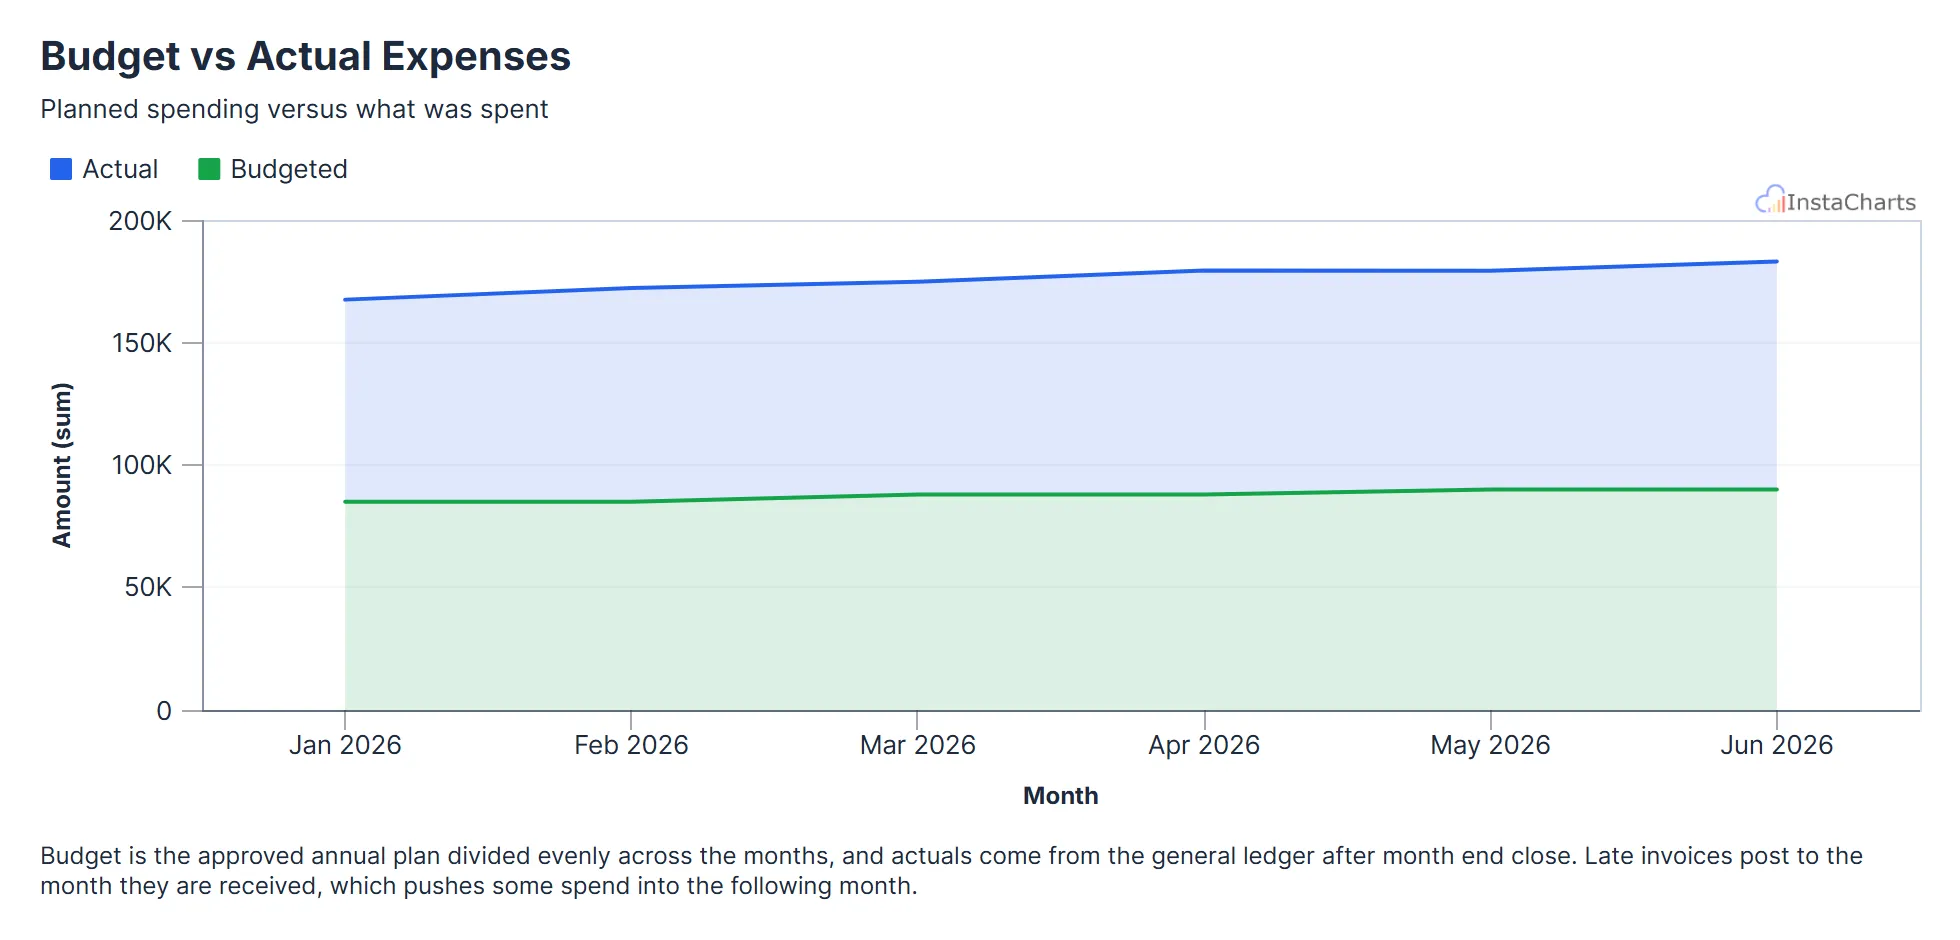
Budget vs Actual Expenses
Budgeted and actual expenses by month, useful for tracking spending against a plan.
View template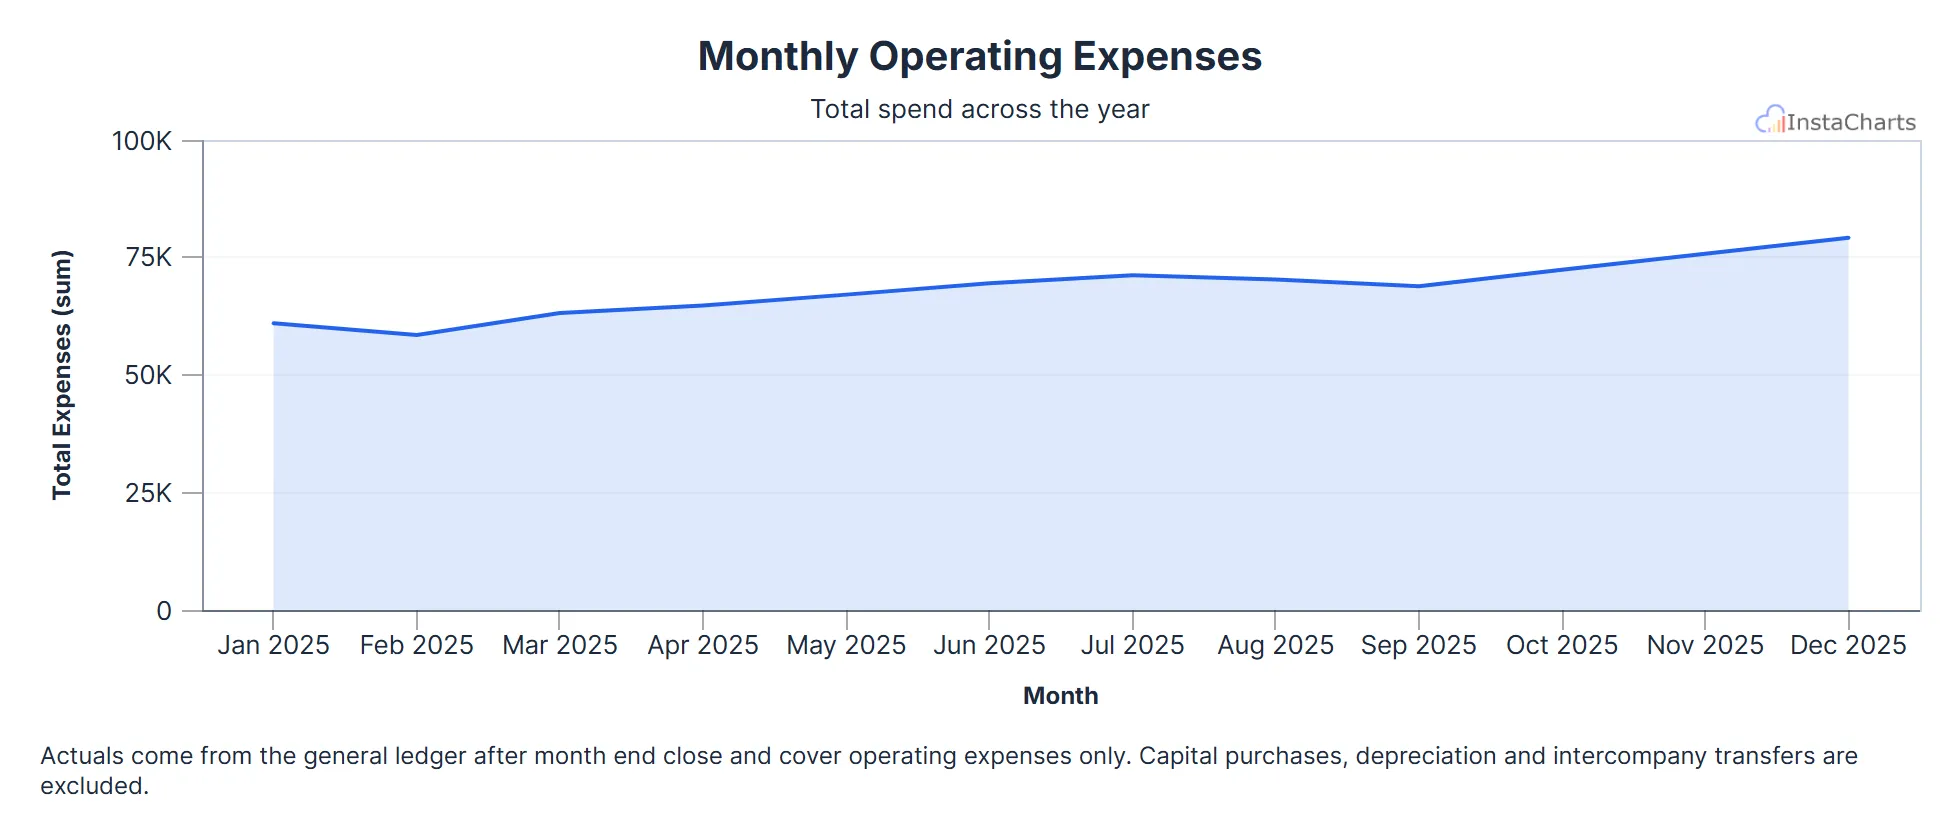 Area Chart
Monthly Operating Expenses
Total operating expenses for each month over a full year.
View template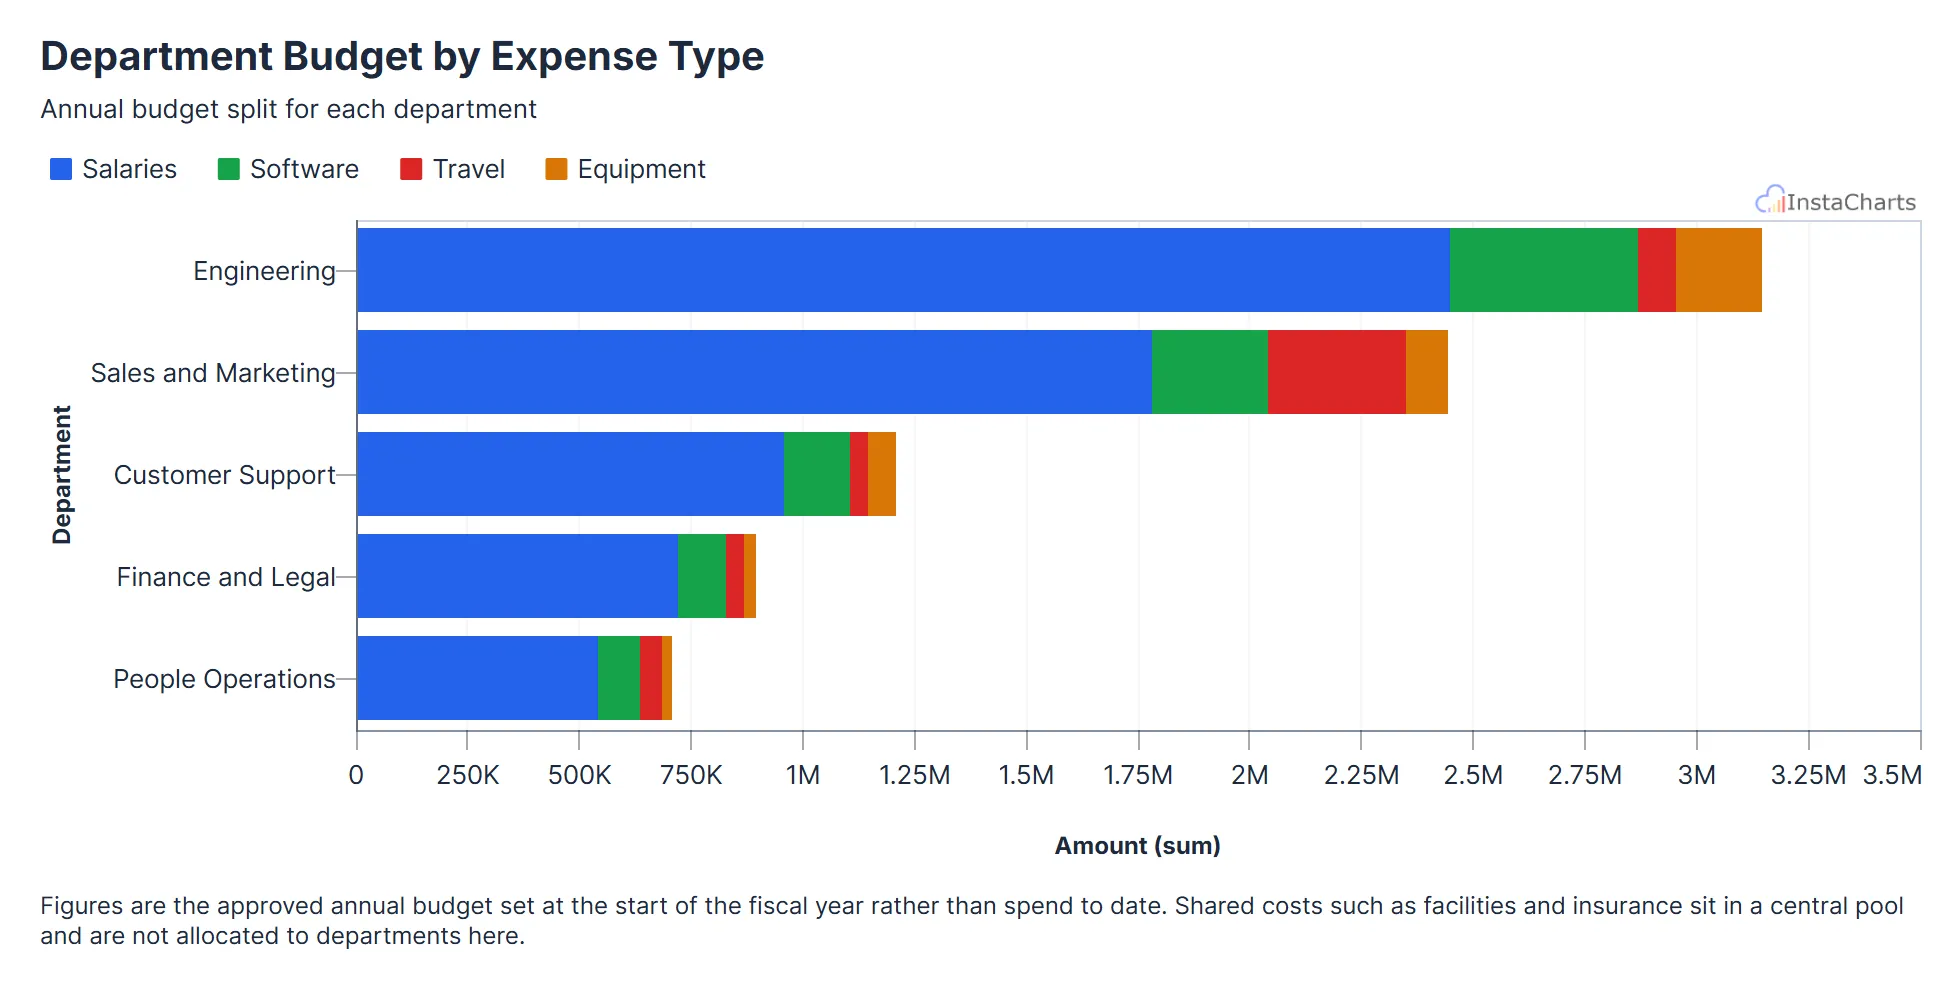 Horizontal Stacked Bar Chart
Department Budget by Expense Type
How each department's annual budget splits across salaries, software, travel and equipment, stacked into horizontal bars.
View template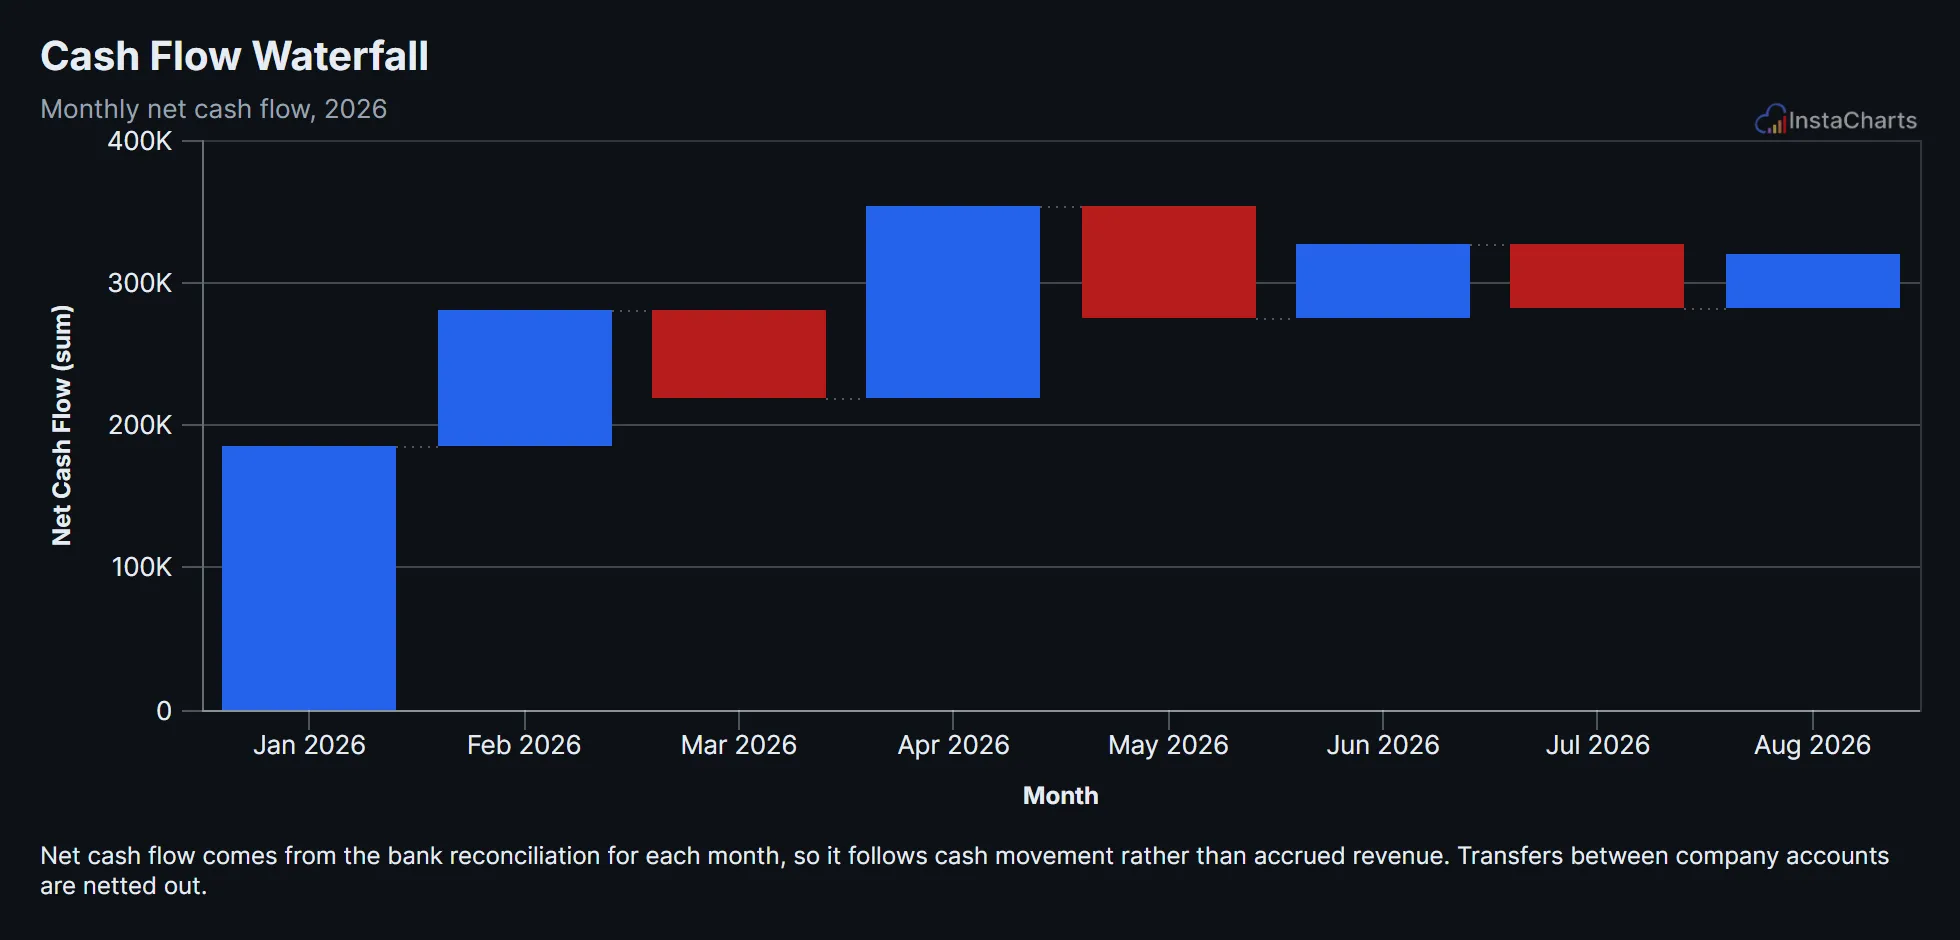 Waterfall Chart
Cash Flow Waterfall
Net cash flow for each month of the year, shown as a waterfall of rises and drops building toward the ending balance.
View template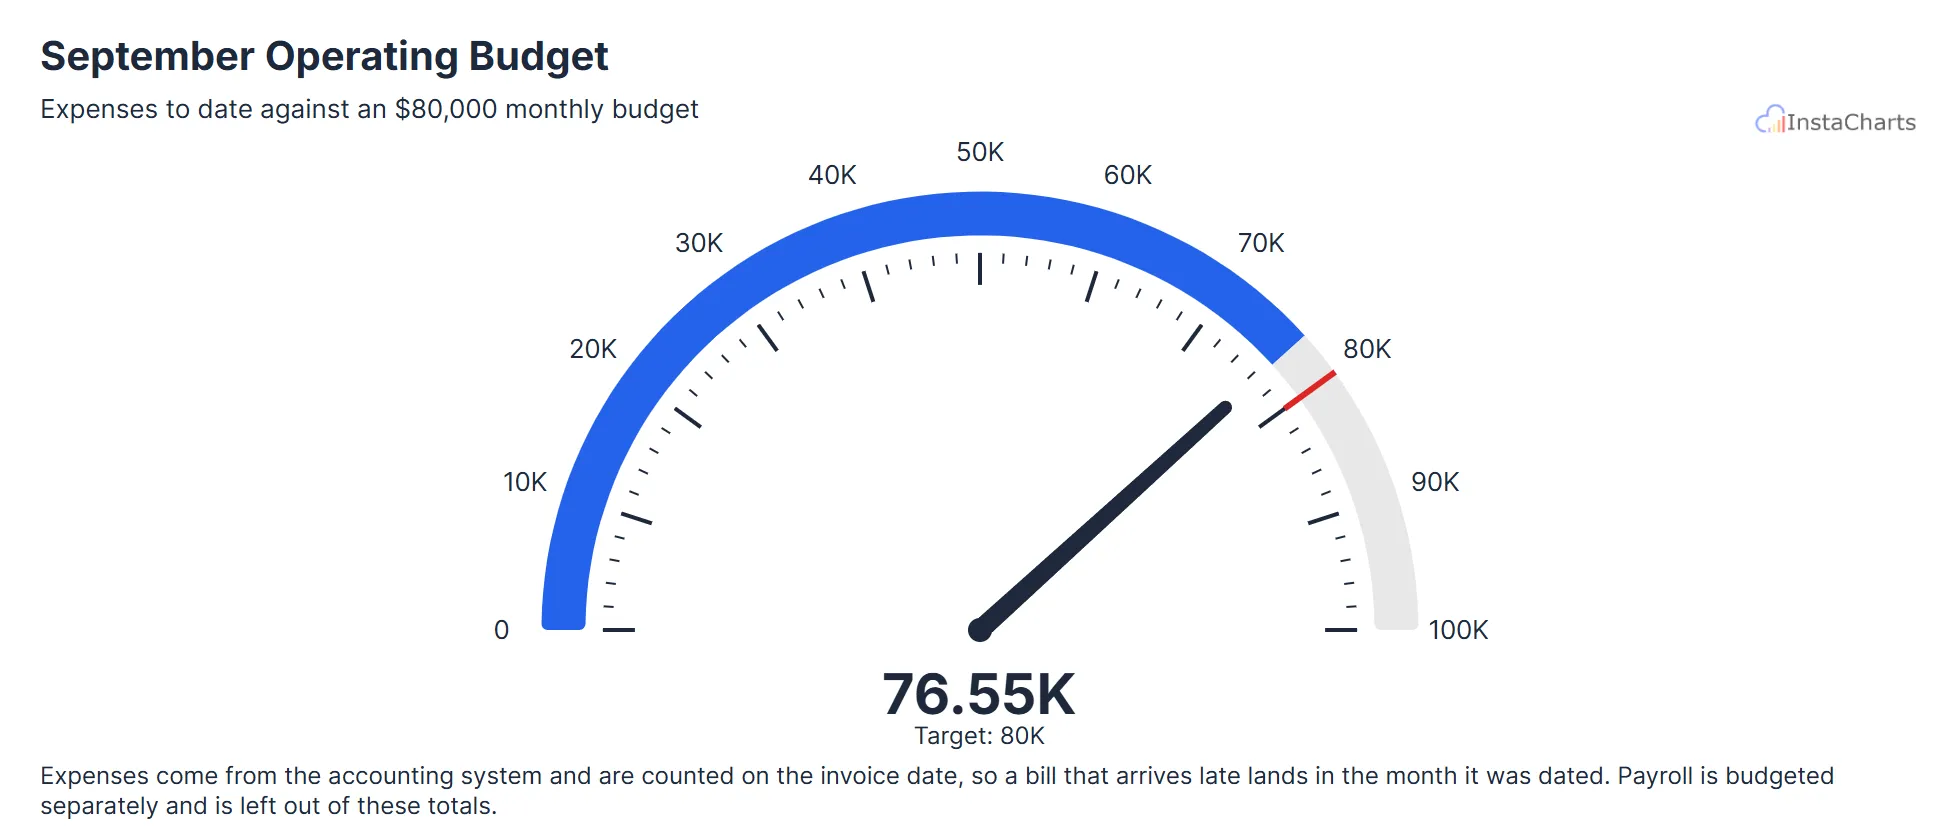 Needle Gauge Chart
Monthly Operating Budget Spent
One month of operating expenses added up and shown on a needle gauge, with the monthly budget marked as the target.
View template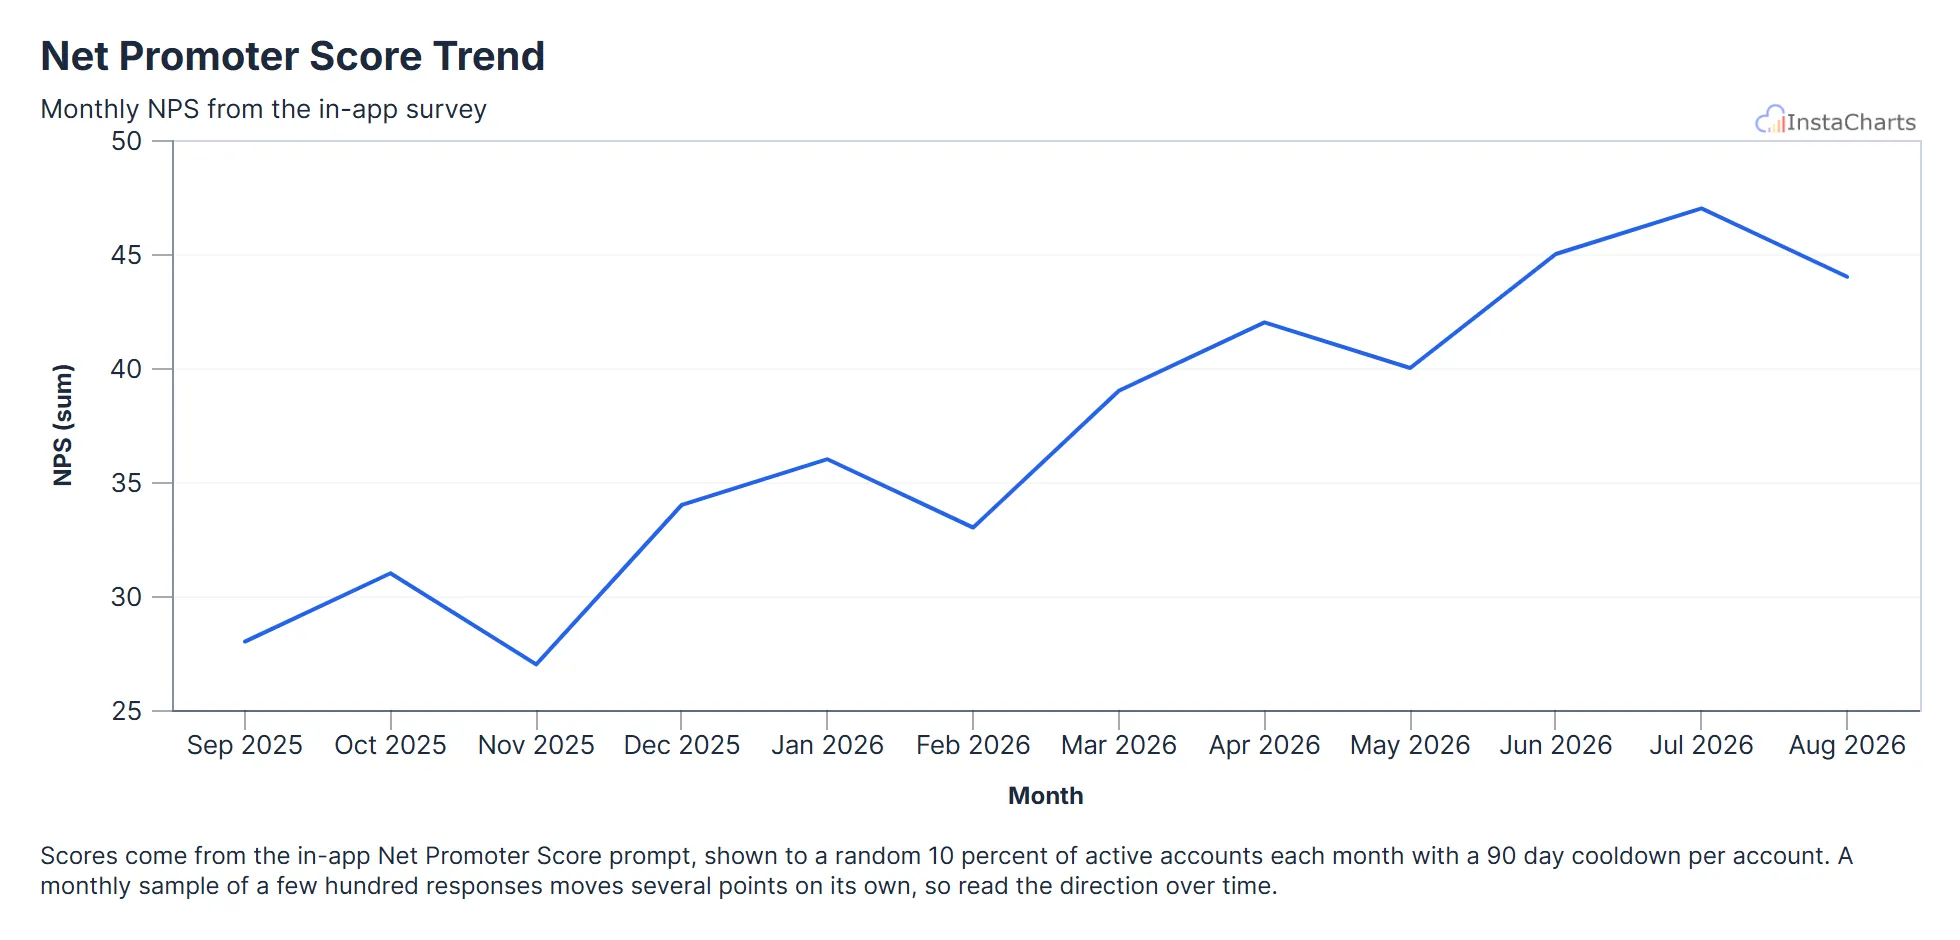 Line Chart
Net Promoter Score Trend
Net Promoter Score from the in-app survey for each month over the last year.
View templateSee all Finance Chart Templates, or browse all chart templates.
Make your own line chart in seconds
InstaCharts makes data visualization easy, so you can build clear reports without design experience.