
Budgets and Spending templates
Budget Chart Templates
6 free templates you can edit online
Budget charts answer two questions: where the money is planned to go and how actual spending compares. These templates cover allocation, spend over time, budget against actuals and cash flow.
- 6 templates
- Real sample data
- No account needed
Budget vs Actual Expenses
Budgets and Spending
Budget Chart Templates
Each template opens in the InstaCharts chart maker with its sample data loaded. Replace the rows with your own numbers, then export, share or embed the chart.
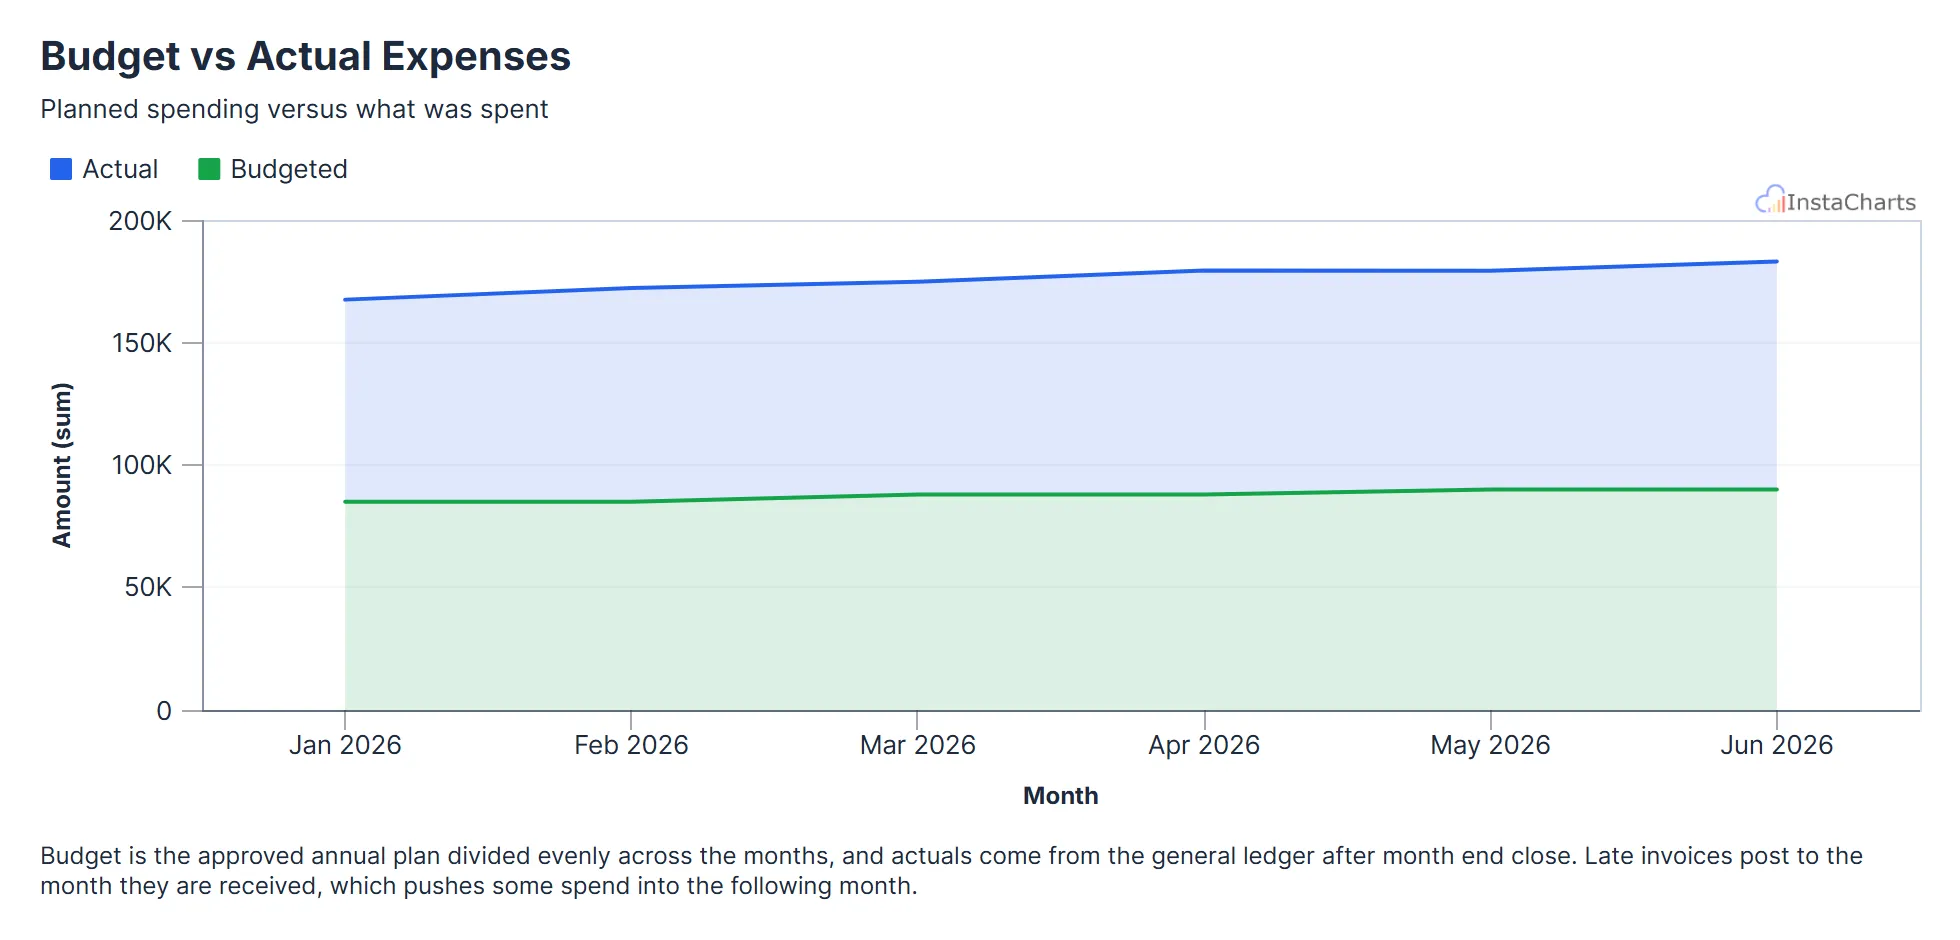 Grouped Area Chart
Budget vs Actual Expenses
Budgeted and actual expenses by month, useful for tracking spending against a plan.
View template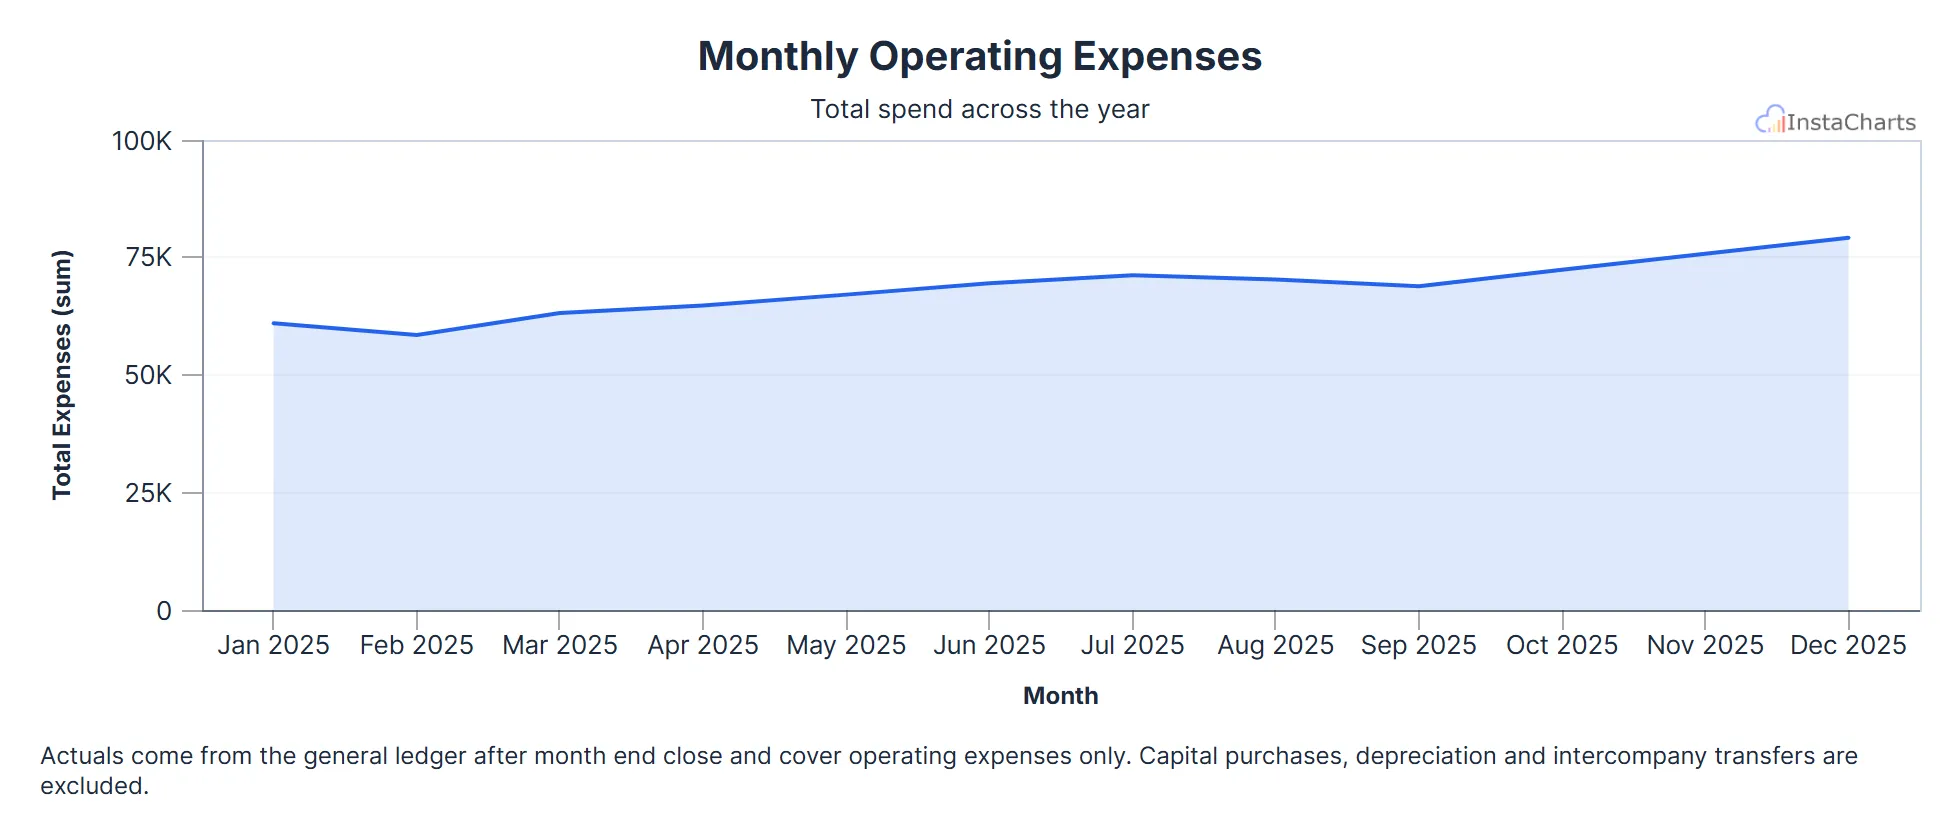 Area Chart
Monthly Operating Expenses
Total operating expenses for each month over a full year.
View template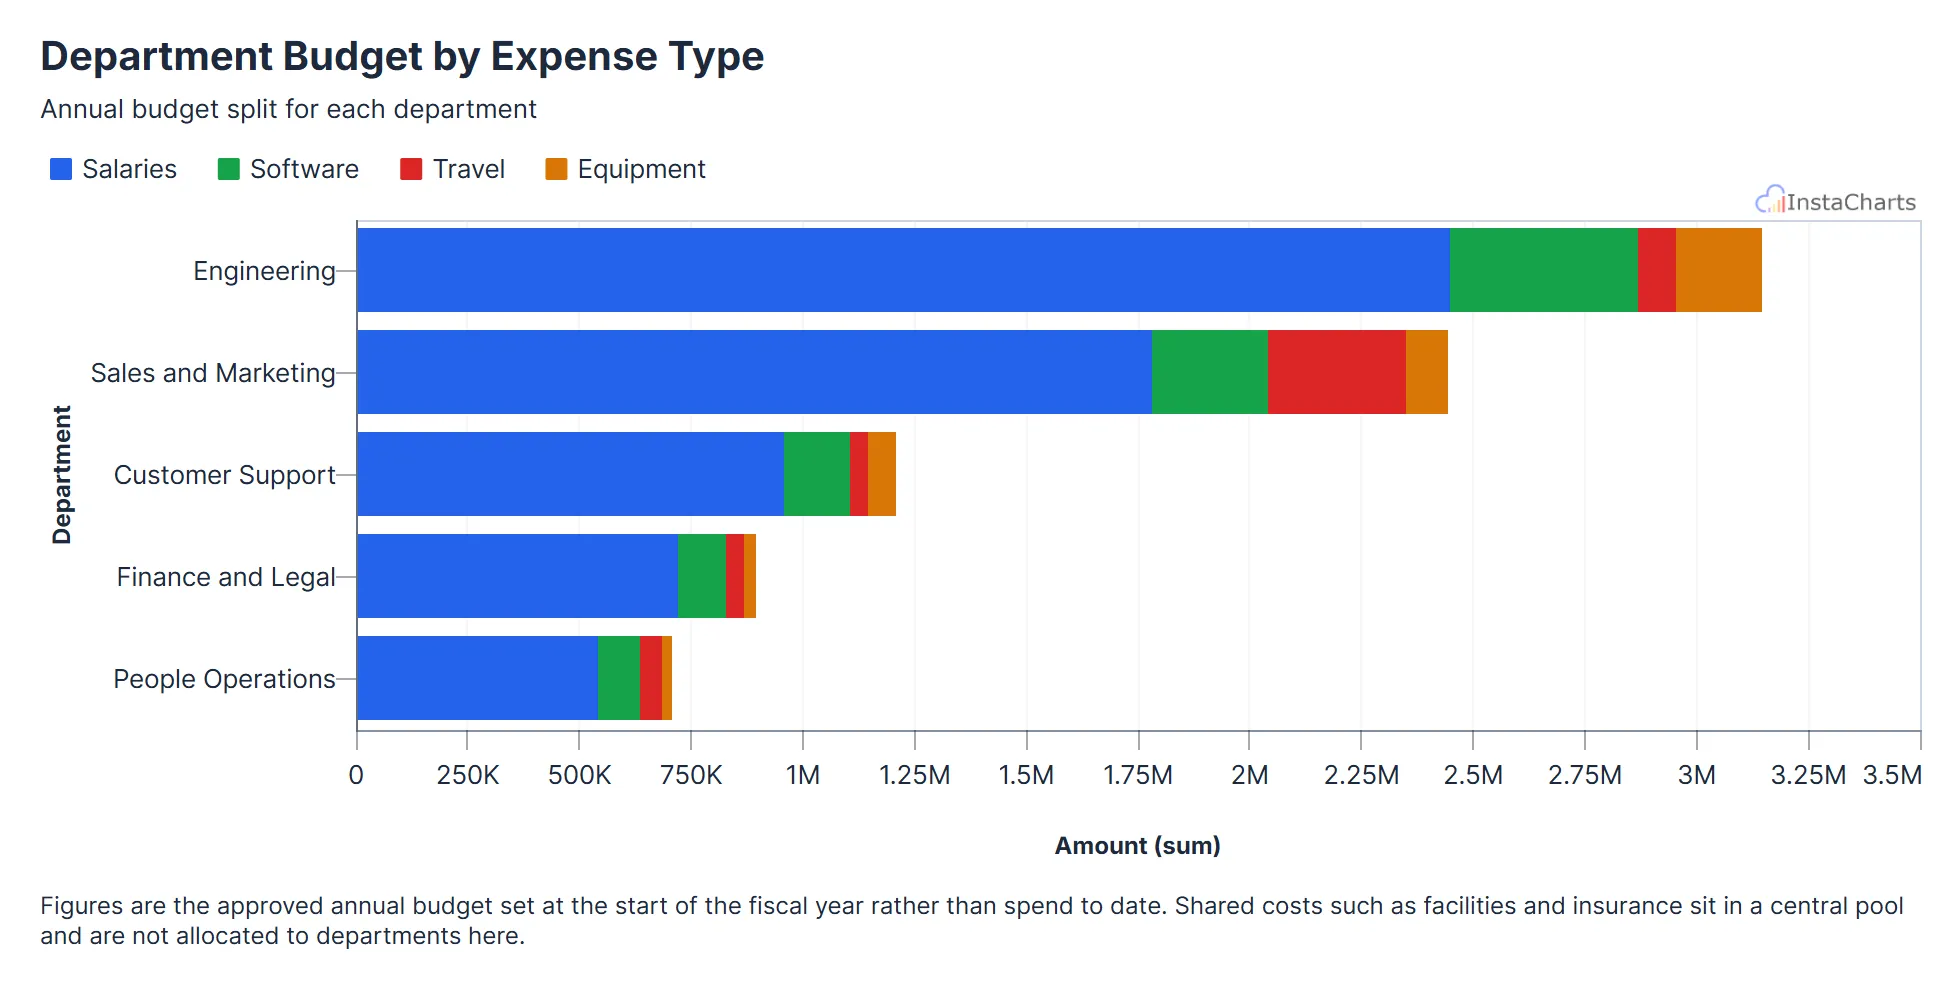 Horizontal Stacked Bar Chart
Department Budget by Expense Type
How each department's annual budget splits across salaries, software, travel and equipment, stacked into horizontal bars.
View template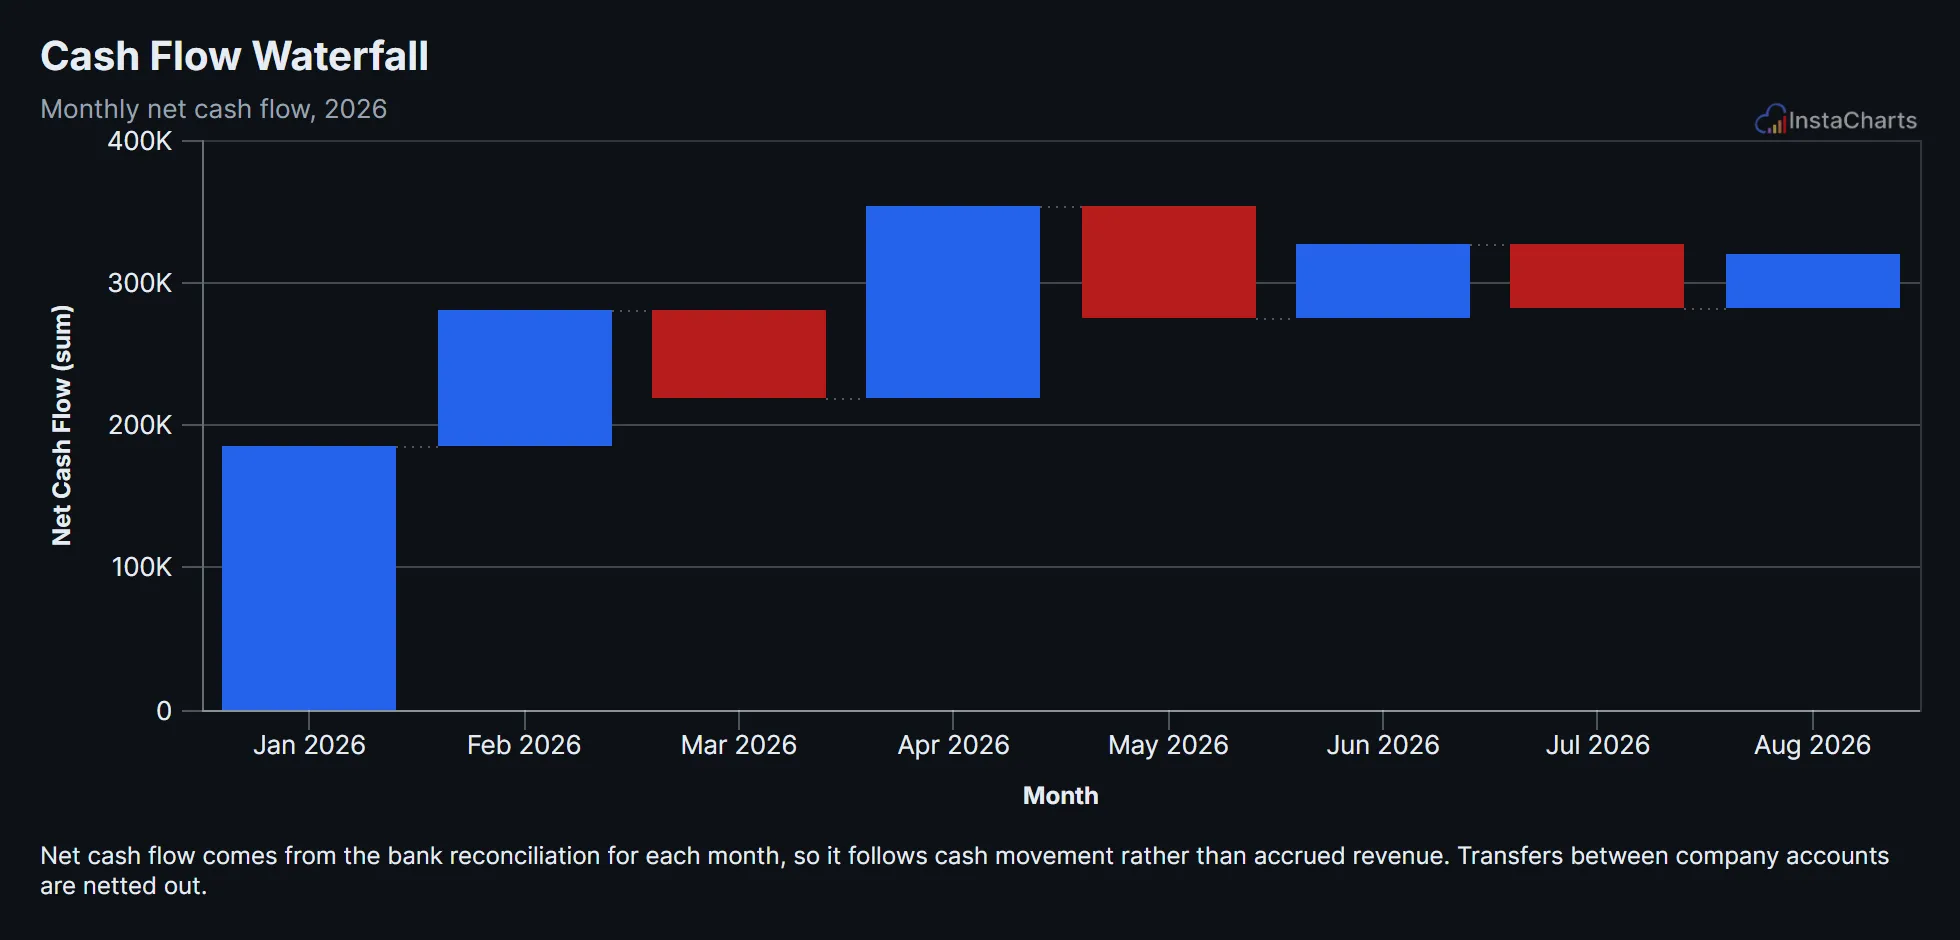 Waterfall Chart
Cash Flow Waterfall
Net cash flow for each month of the year, shown as a waterfall of rises and drops building toward the ending balance.
View template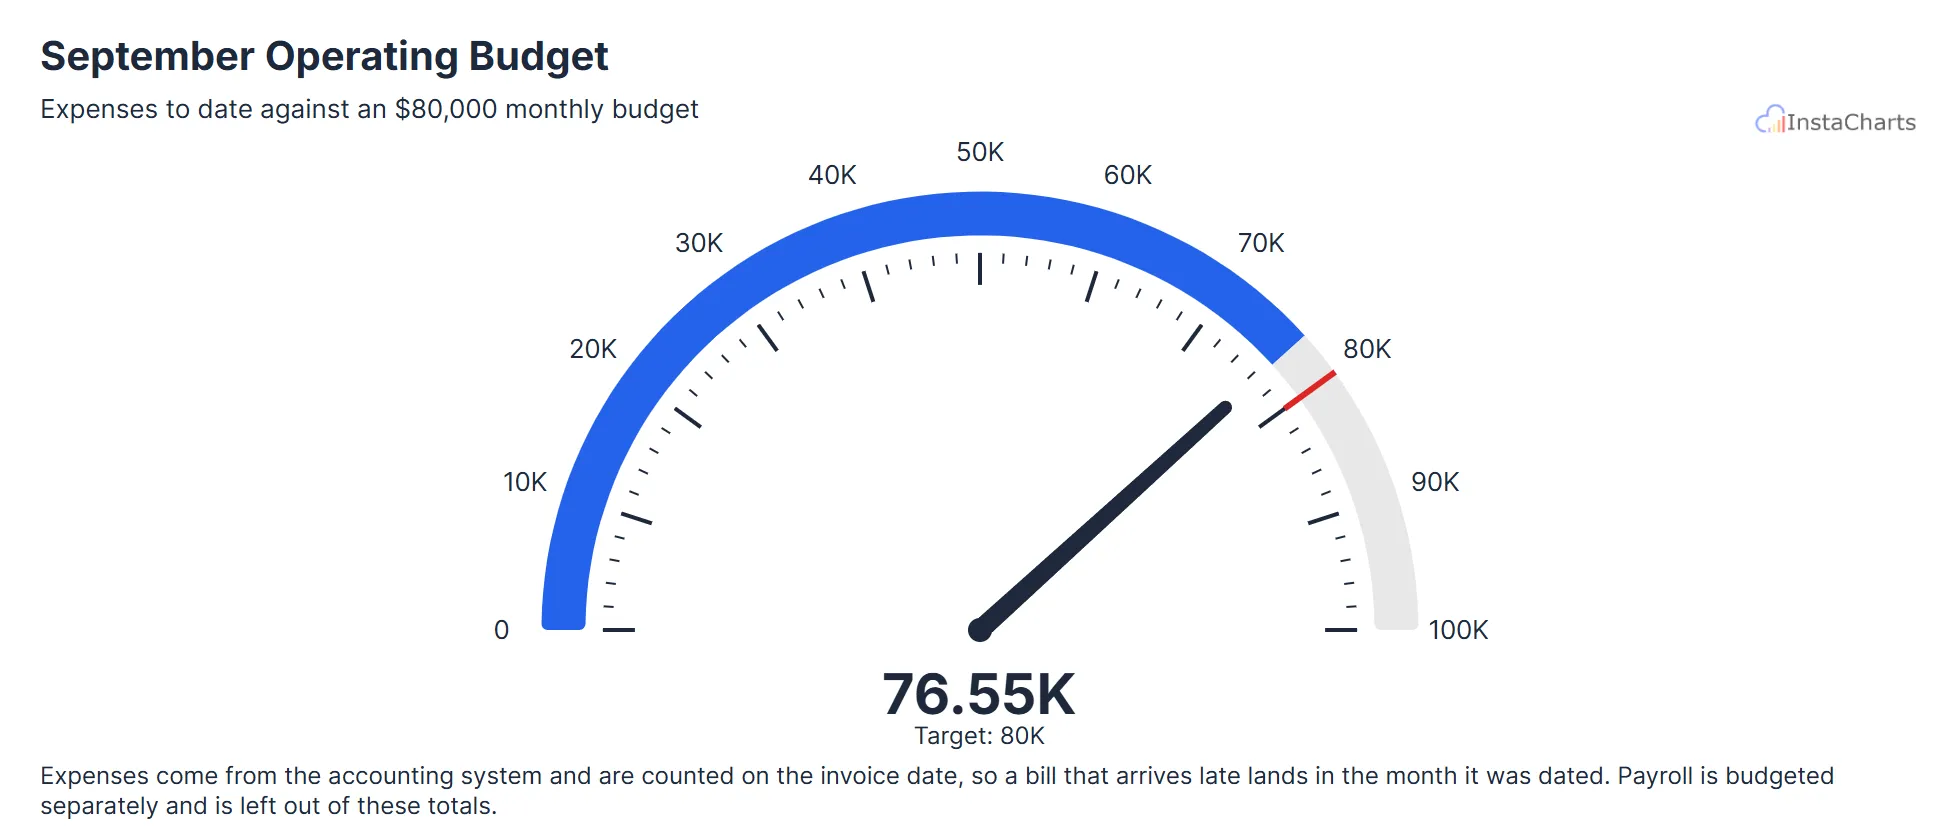 Needle Gauge Chart
Monthly Operating Budget Spent
One month of operating expenses added up and shown on a needle gauge, with the monthly budget marked as the target.
View template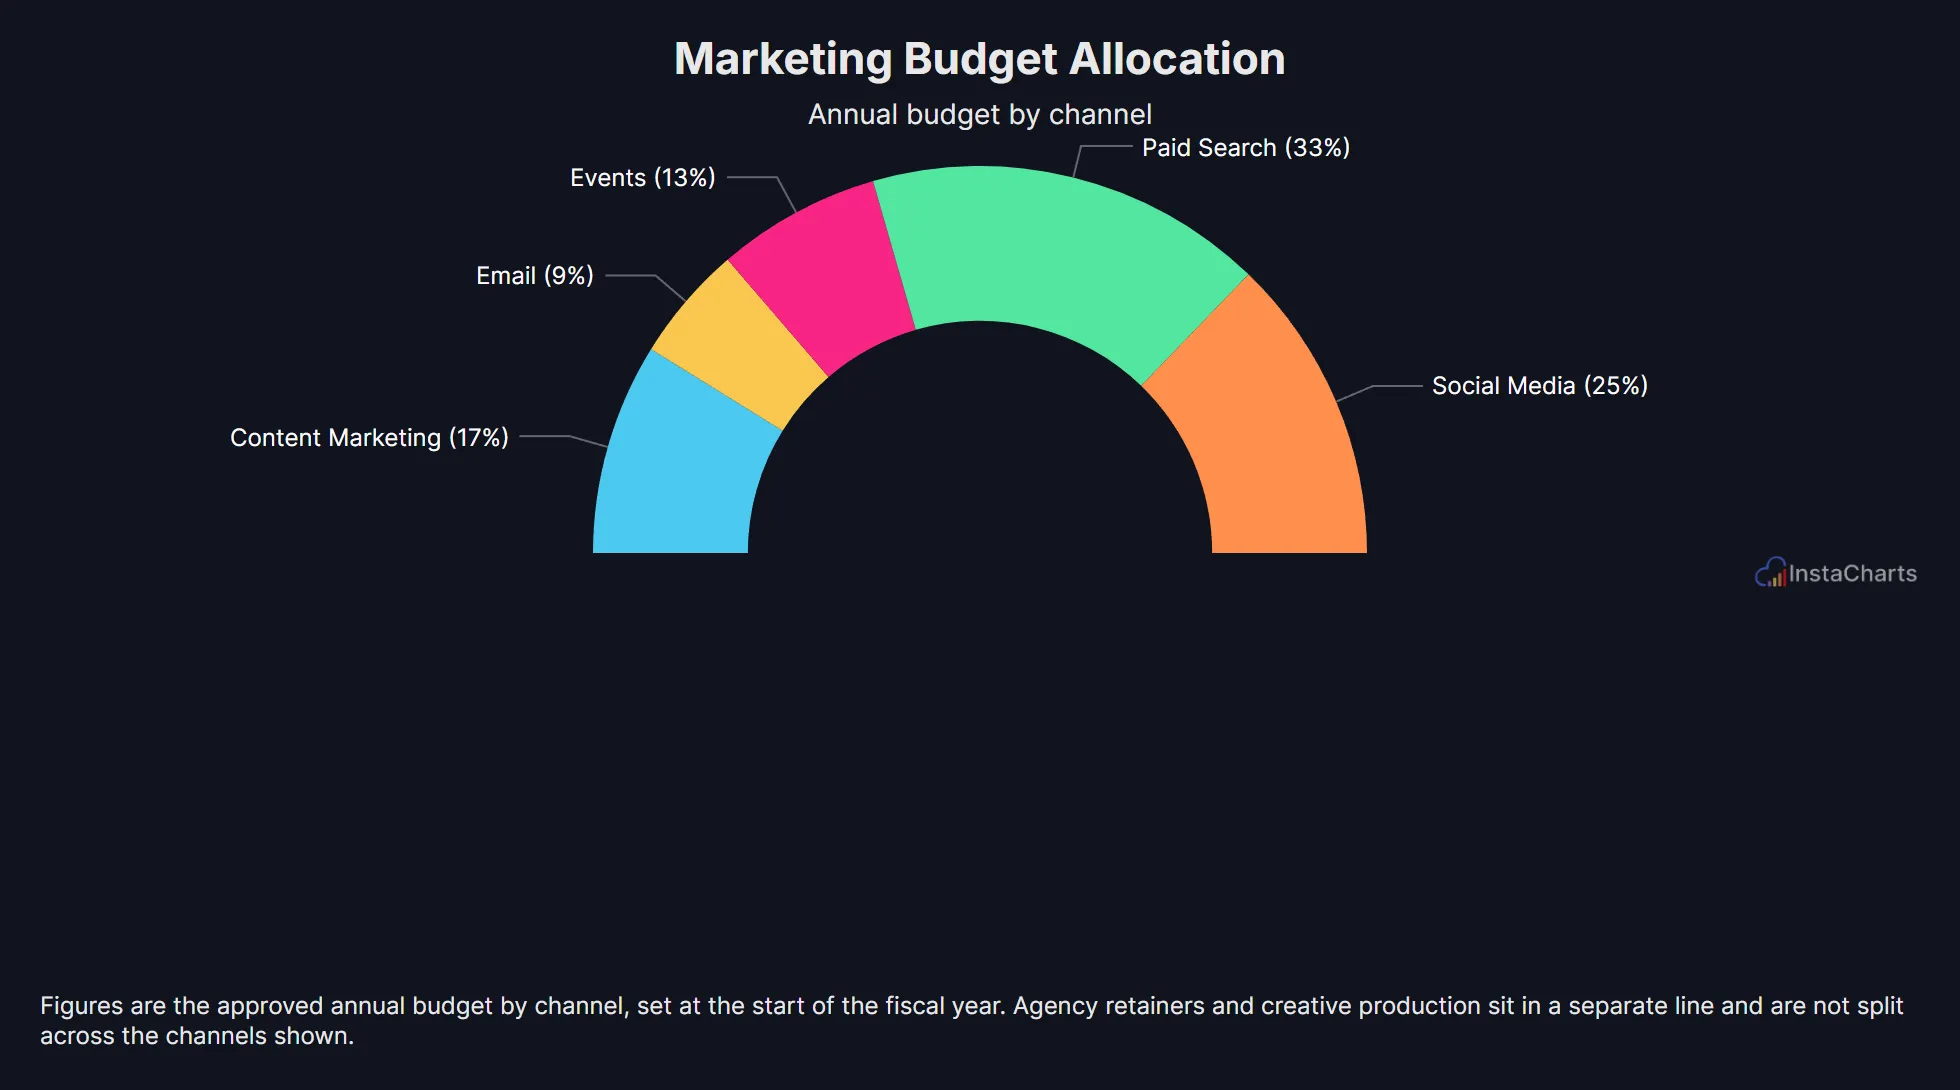 Semi Circle Donut Chart
Marketing Budget Allocation
Annual marketing budget split across five channels, shown as a half donut.
View templateBrowse templates by industry
Craft professional charts in seconds
InstaCharts makes data visualization easy, so you can build clear reports without design experience.