
Comparisons templates
Comparison Chart Templates
13 free templates you can edit online
Comparison charts put several groups side by side so the differences stand out. These templates compare regions, industries, teams, segments and time blocks with grouped bars, radar charts and heatmaps.
- 13 templates
- Real sample data
- No account needed
Support Tickets by Day and Hour
Comparisons
Comparison Chart Templates
Each template opens in the InstaCharts chart maker with its sample data loaded. Replace the rows with your own numbers, then export, share or embed the chart.
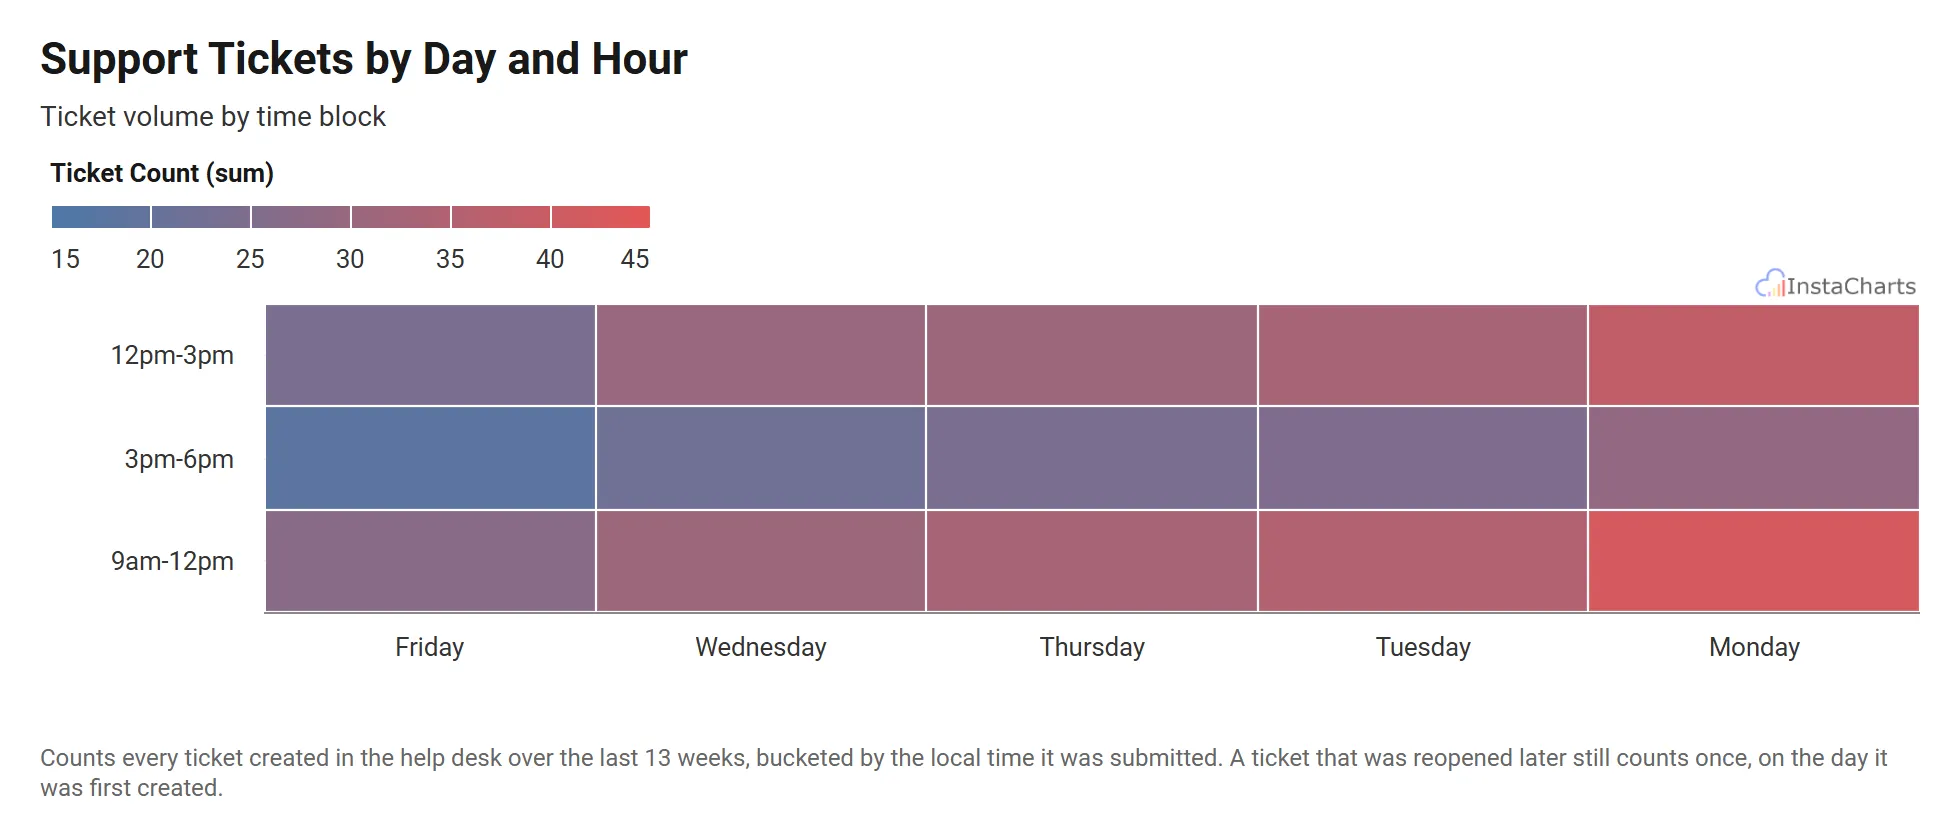 Heatmap
Support Tickets by Day and Hour
Customer support ticket volume by day of the week and time block.
View template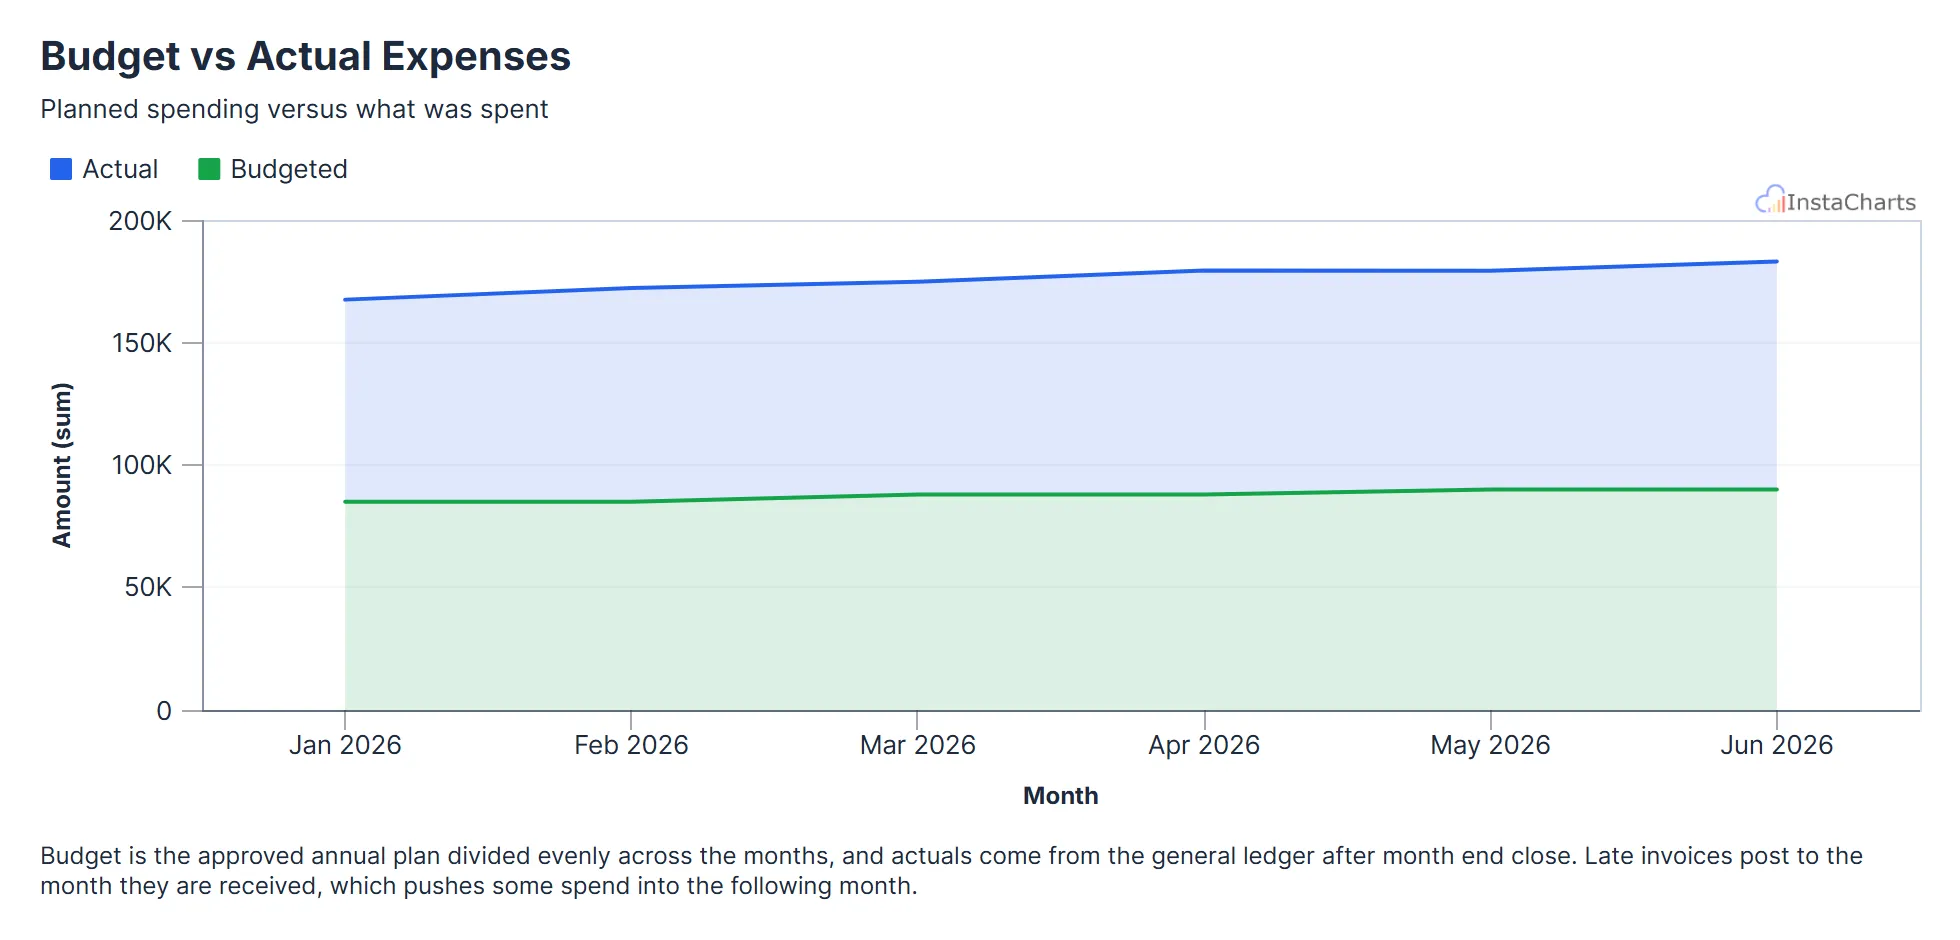 Grouped Area Chart
Budget vs Actual Expenses
Budgeted and actual expenses by month, useful for tracking spending against a plan.
View template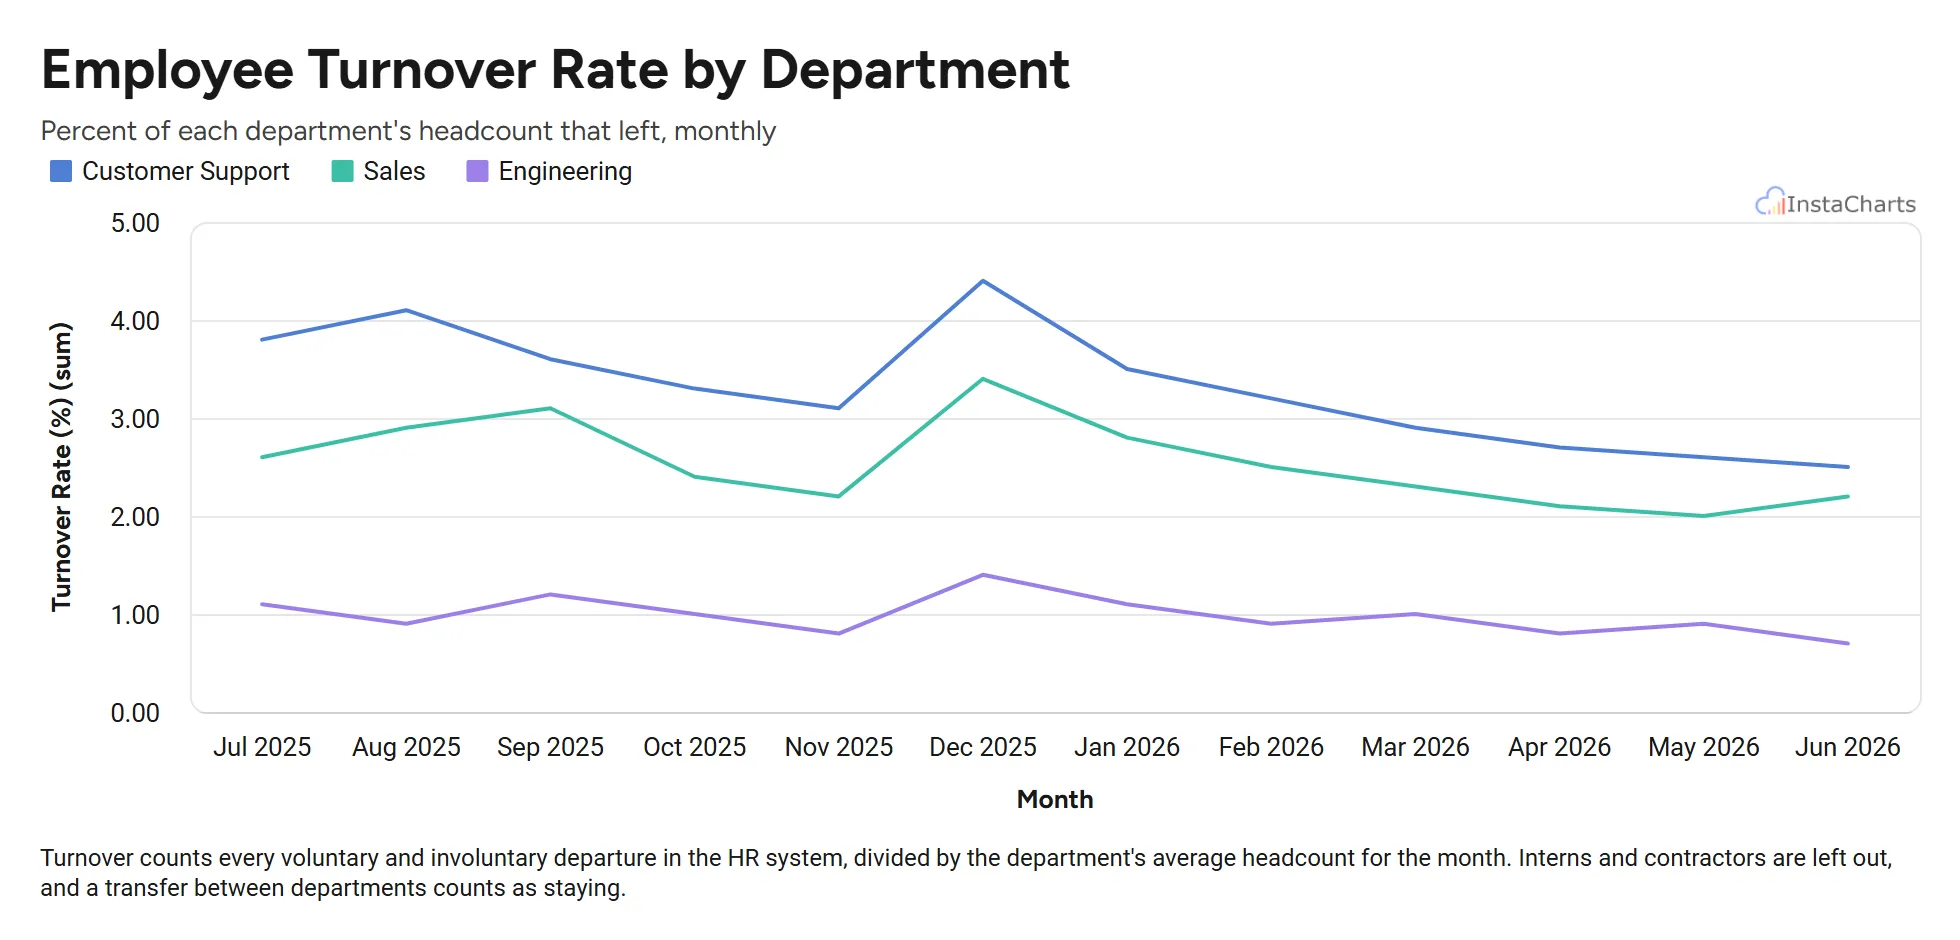 Grouped Line Chart
Employee Turnover by Department
Monthly employee turnover rate for sales, engineering and customer support over twelve months.
View template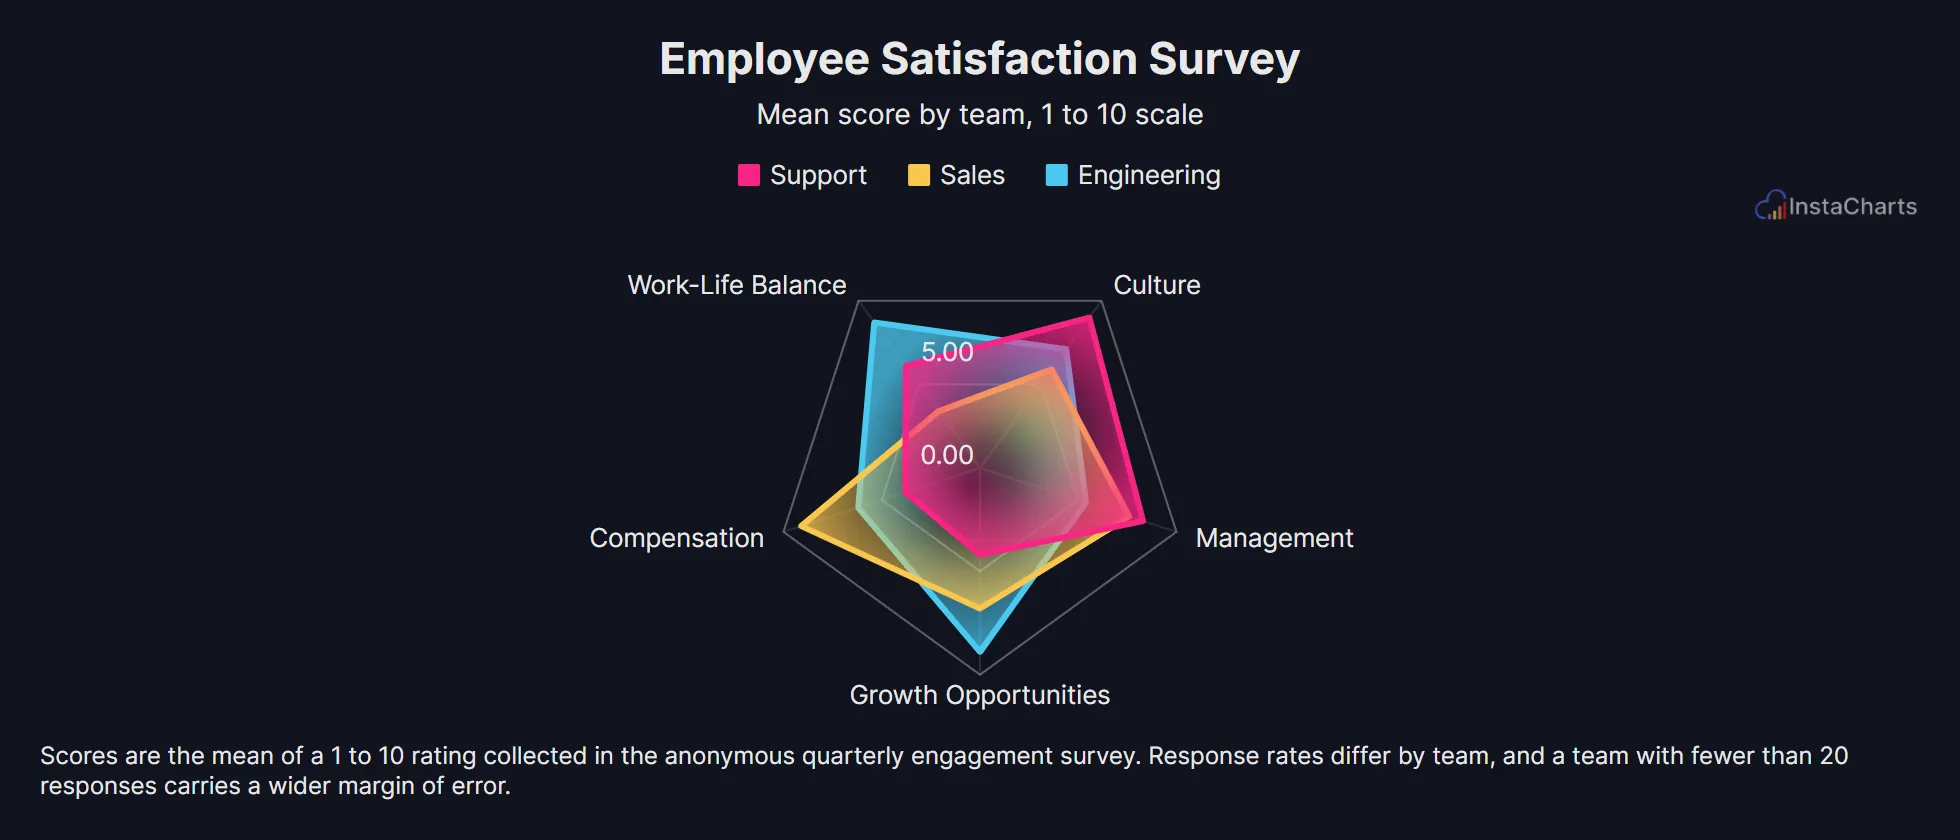 Radar Chart
Employee Satisfaction Survey
Survey scores across compensation, work-life balance, management, growth and culture for three teams.
View template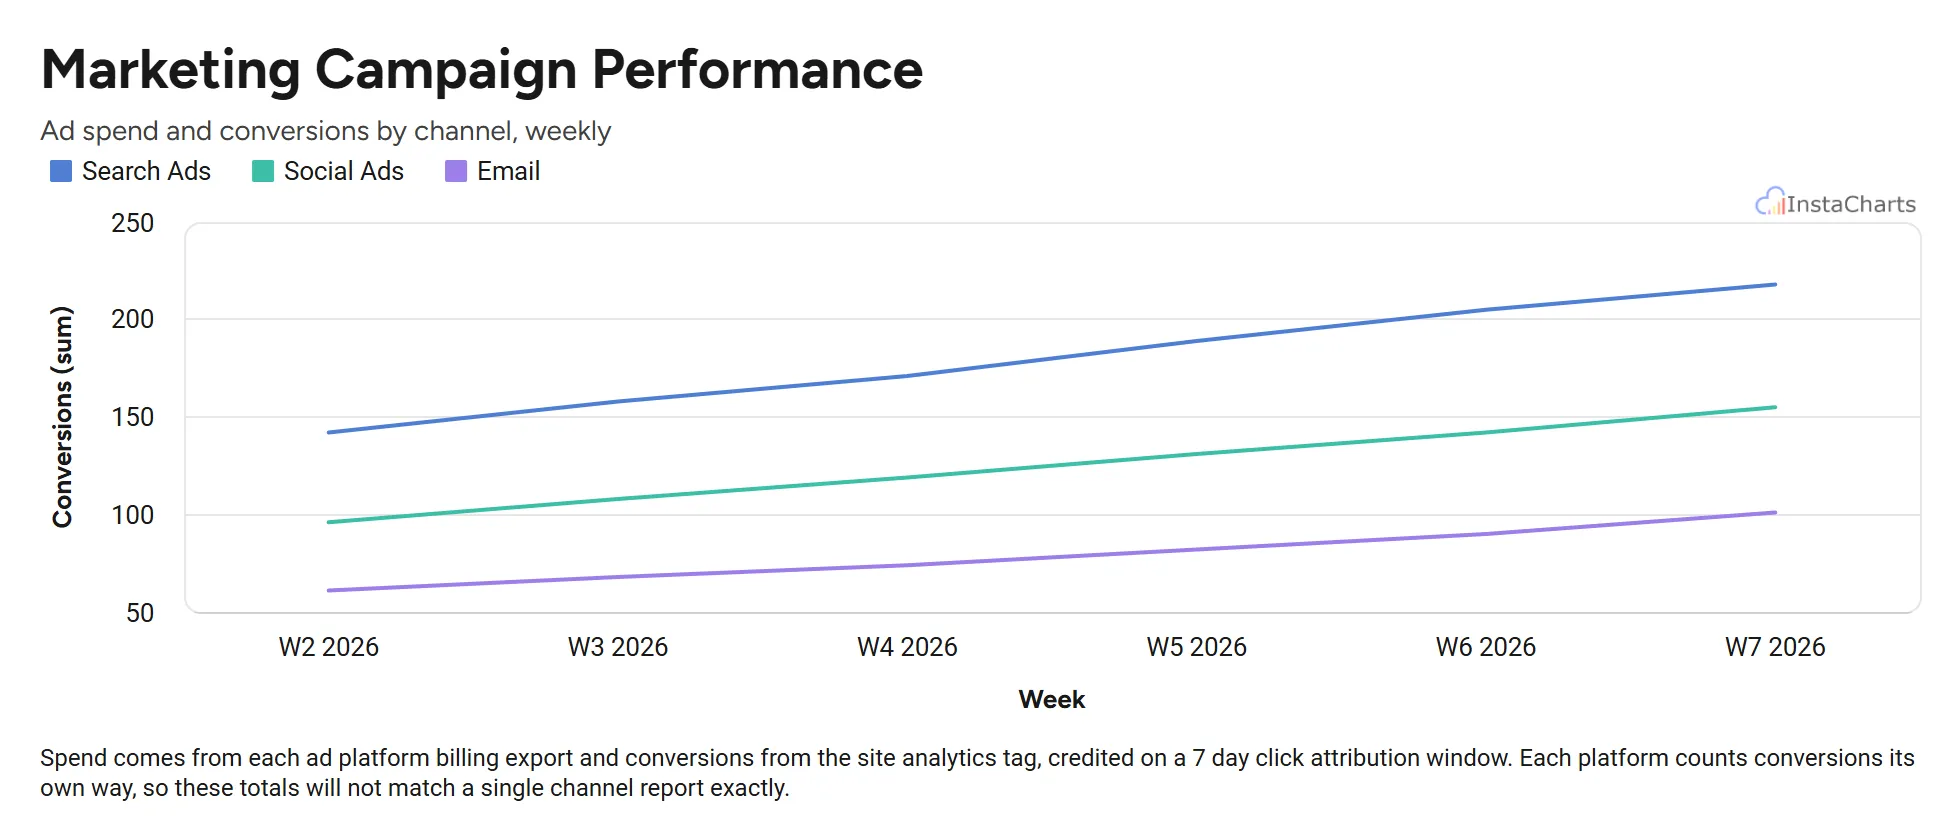 Grouped Line Chart
Marketing Campaign Performance
Weekly ad spend and conversions for search, social and email campaigns over a six week period.
View template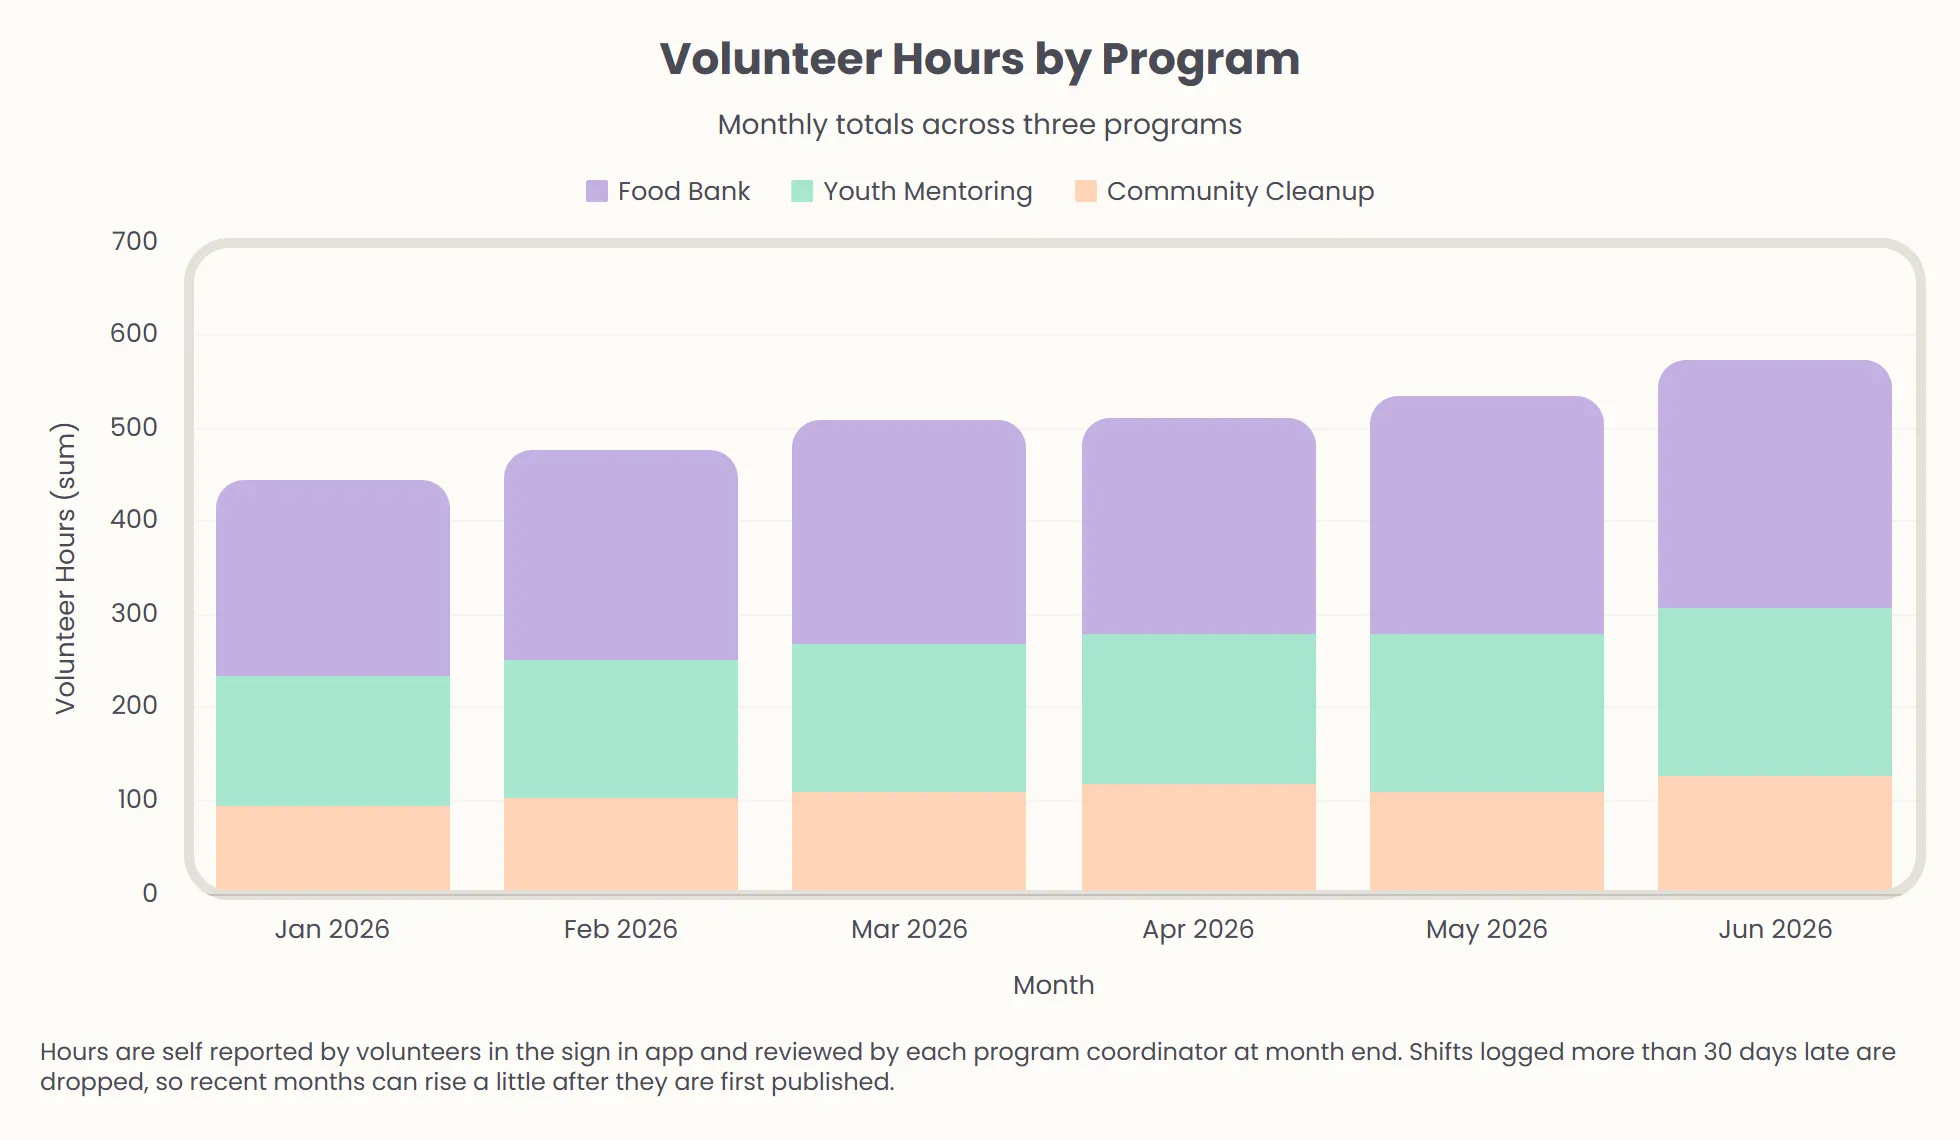 Stacked Bar Chart
Volunteer Hours by Program
Volunteer hours logged each month across three community programs.
View template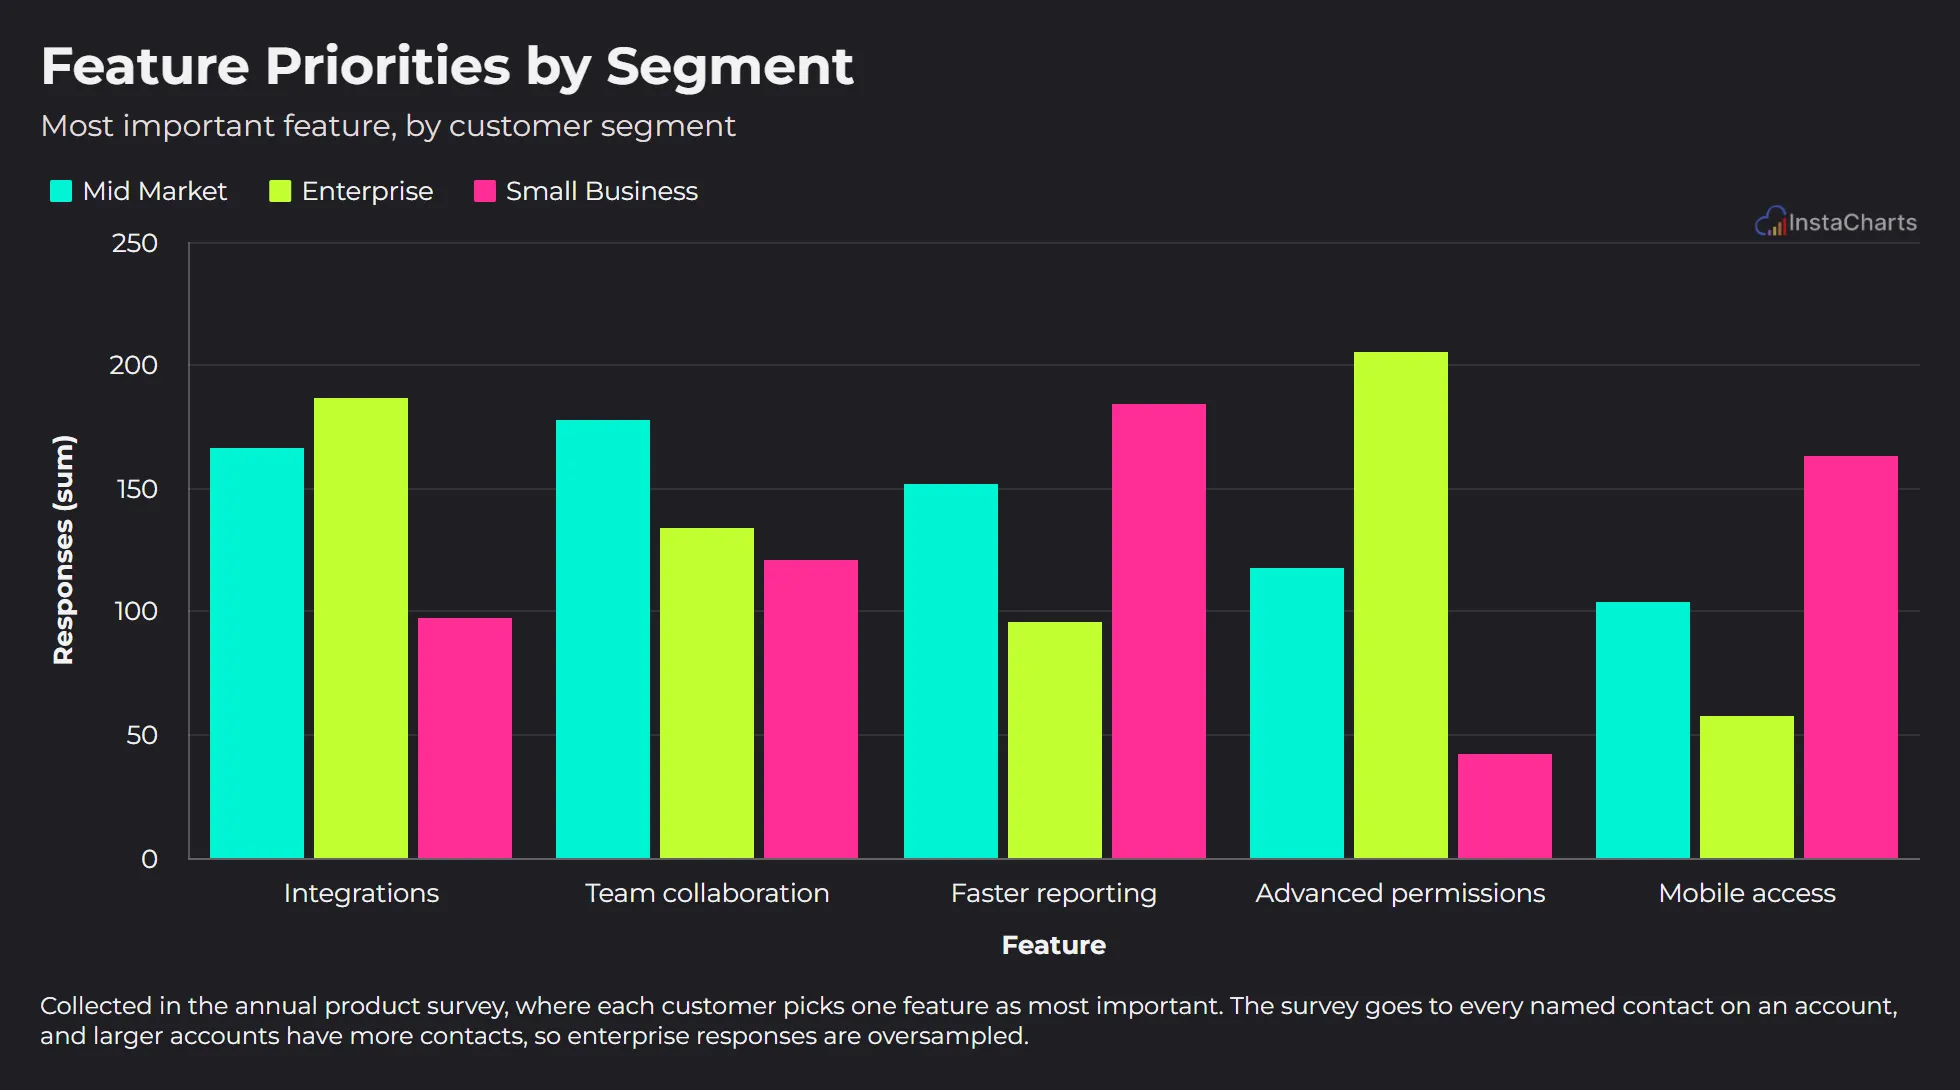 Grouped Bar Chart
Feature Priorities by Segment
The feature each customer segment picked as most important in the annual product survey.
View template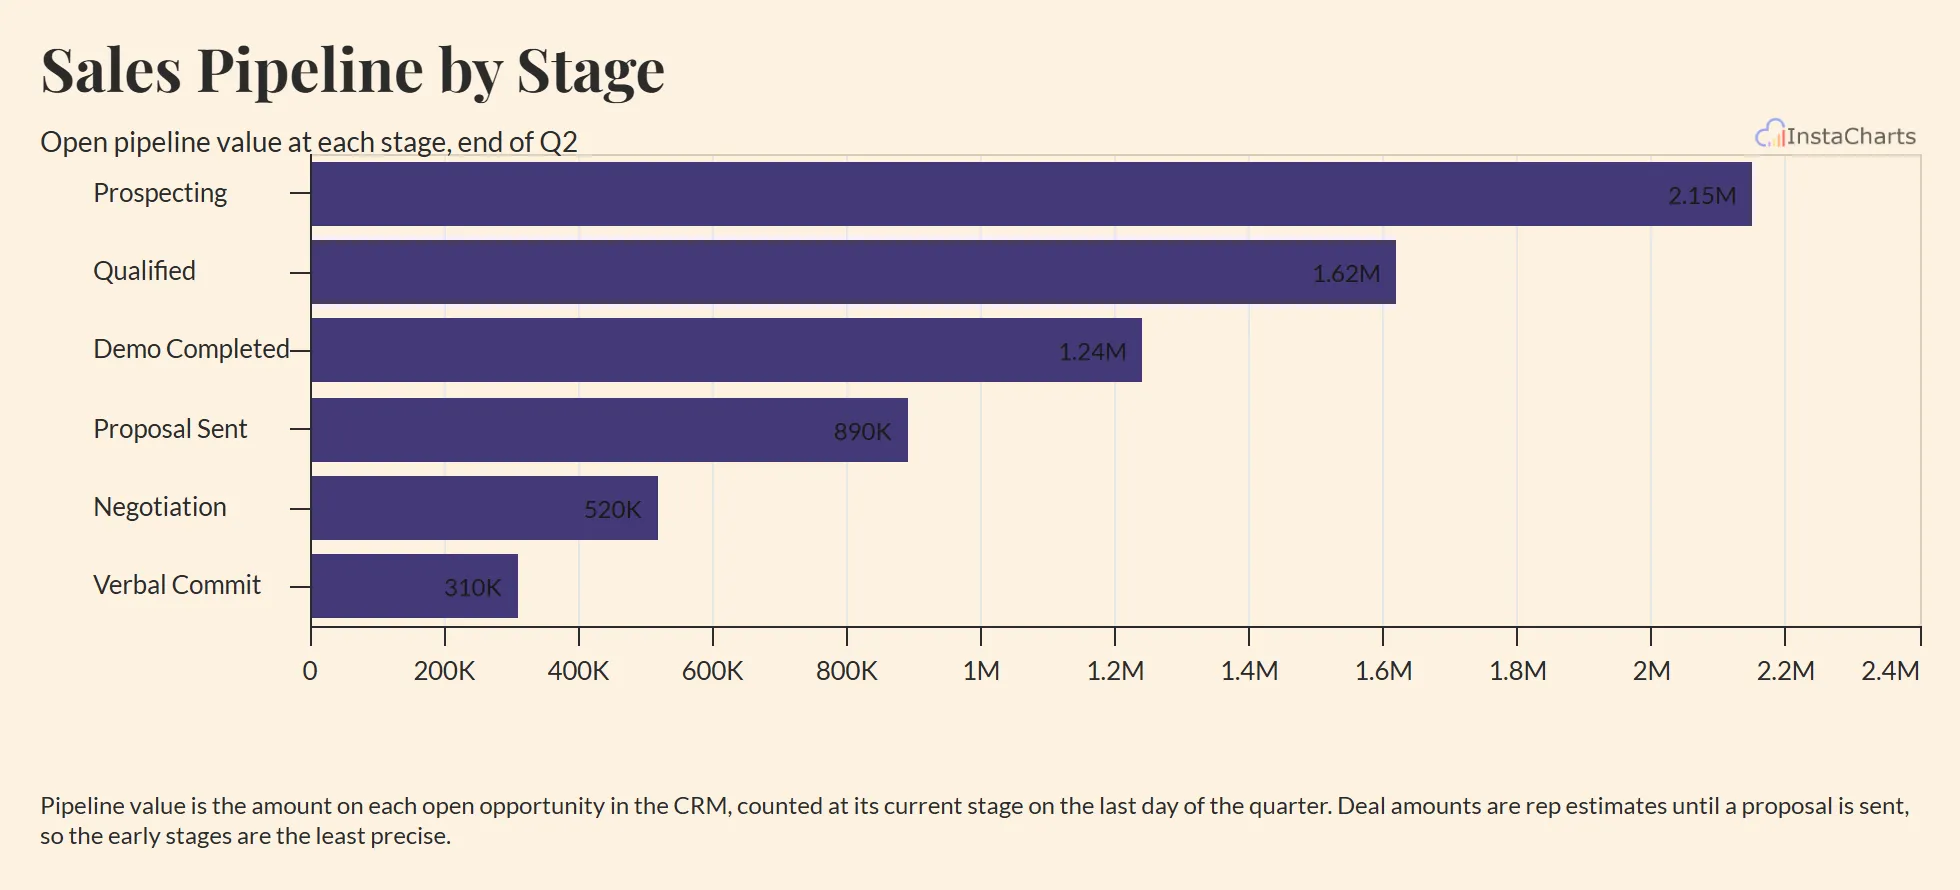 Horizontal Bar Chart
Sales Pipeline by Stage
Open pipeline value at each deal stage, from first contact to verbal commit, drawn as horizontal bars in stage order.
View template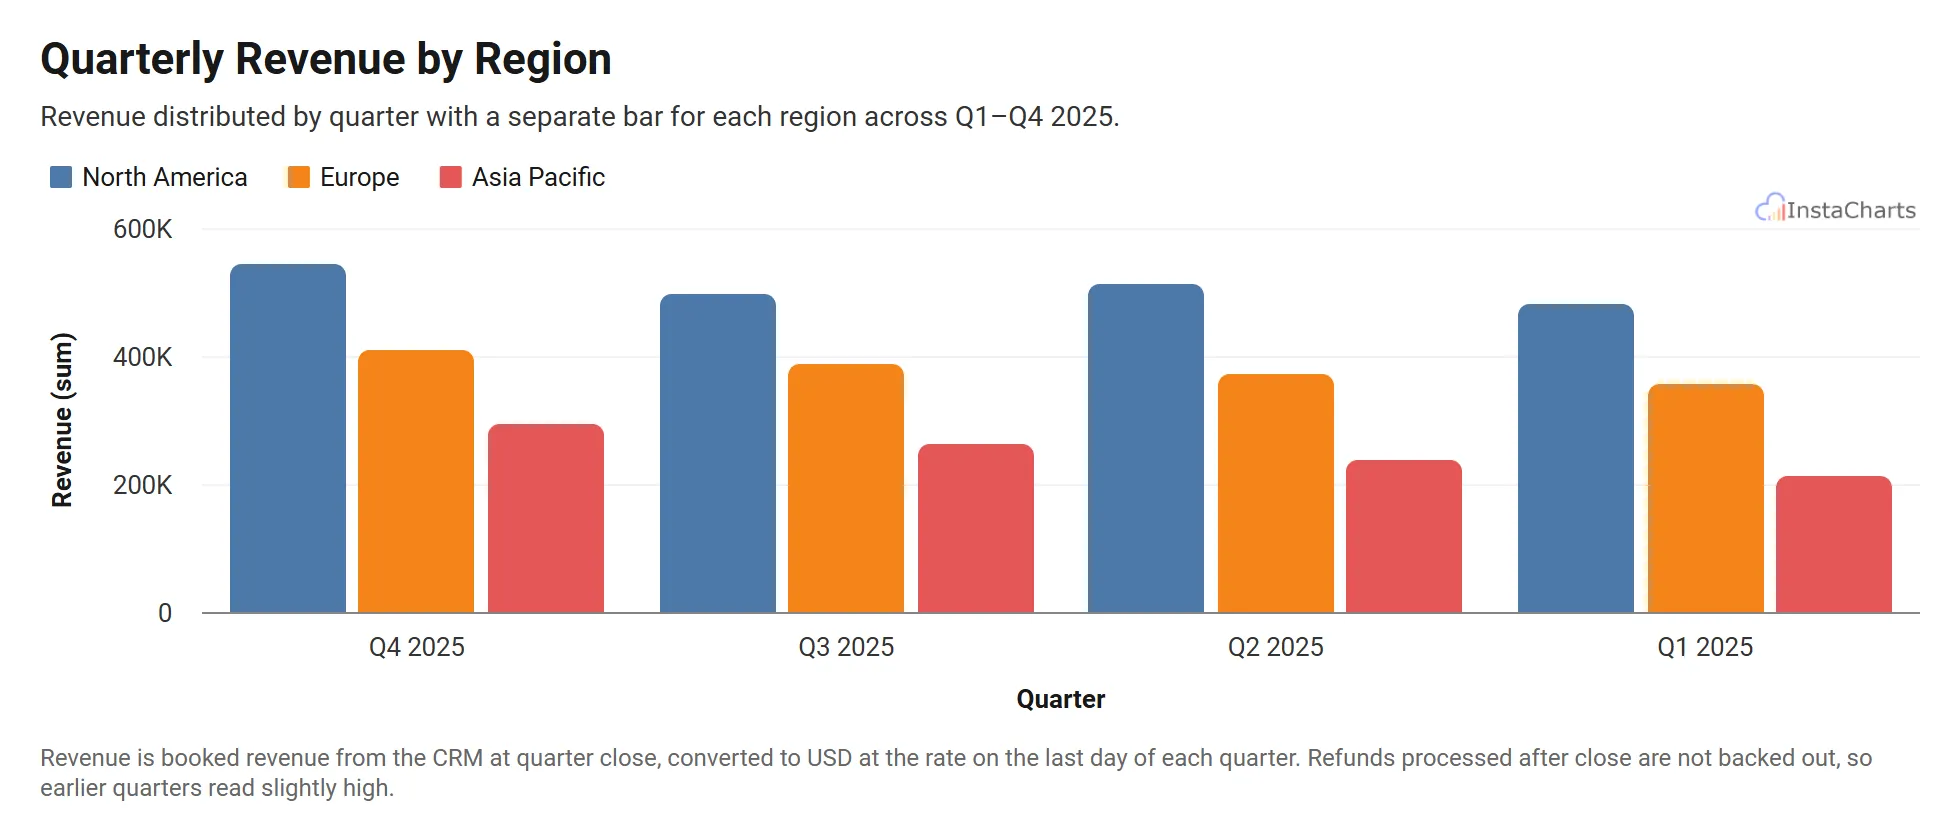 Grouped Bar Chart
Quarterly Revenue by Region
Revenue across North America, Europe and Asia Pacific for four quarters.
View template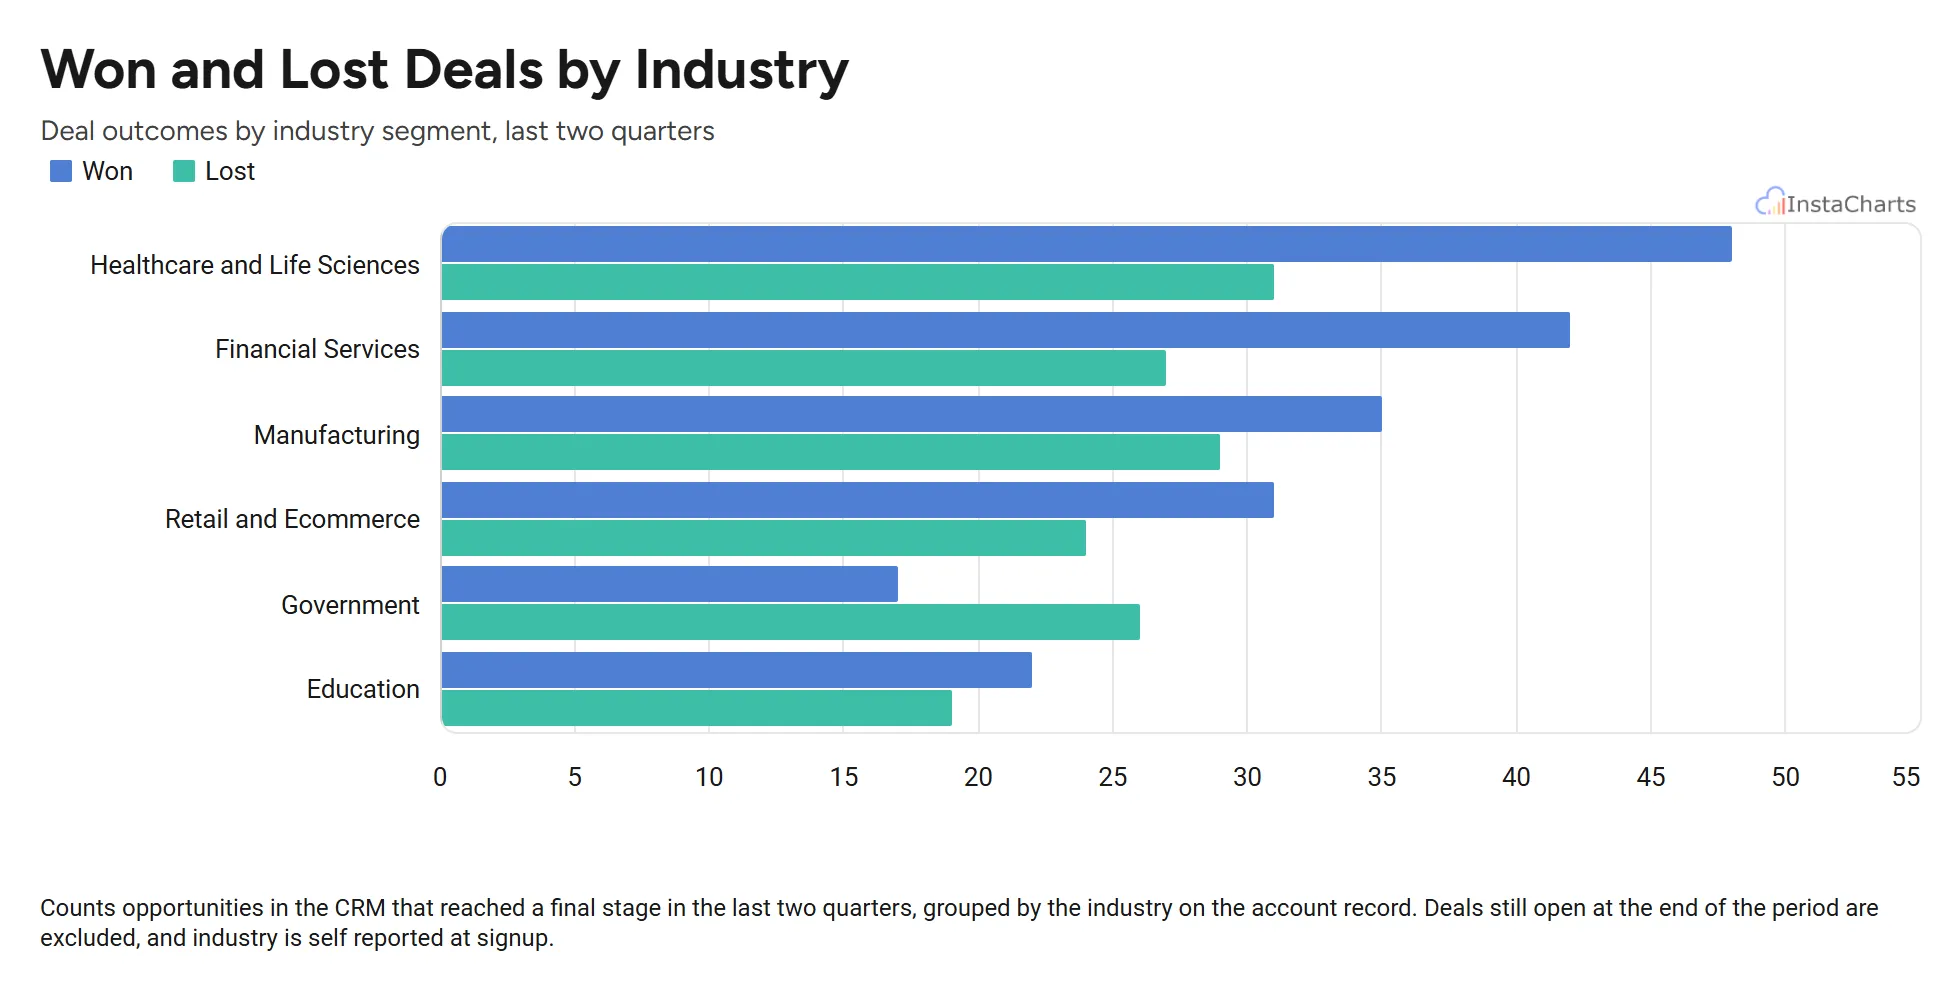 Horizontal Grouped Bar Chart
Won and Lost Deals by Industry
Deals won and deals lost in each industry segment, drawn as horizontal bars so the industry names stay readable.
View template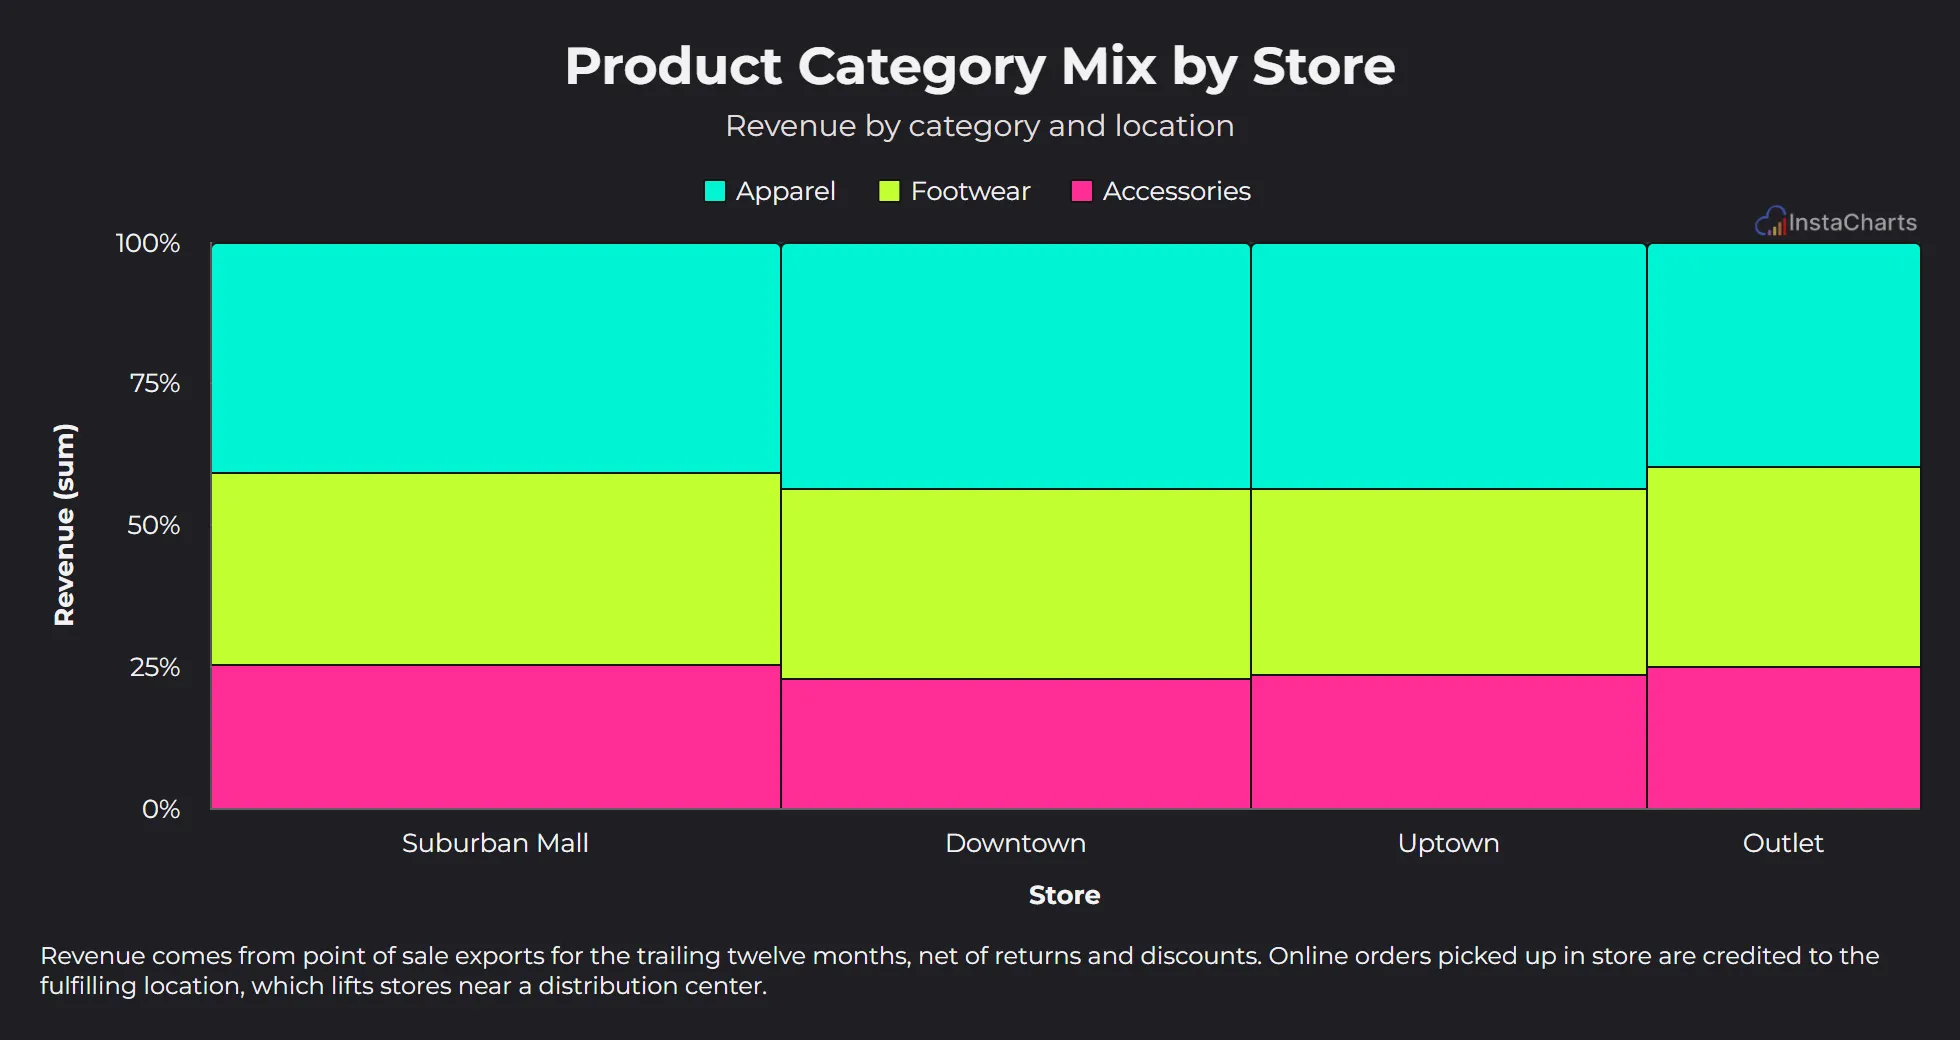 Mekko Chart
Product Category Mix by Store
Revenue by product category for each retail store location.
View template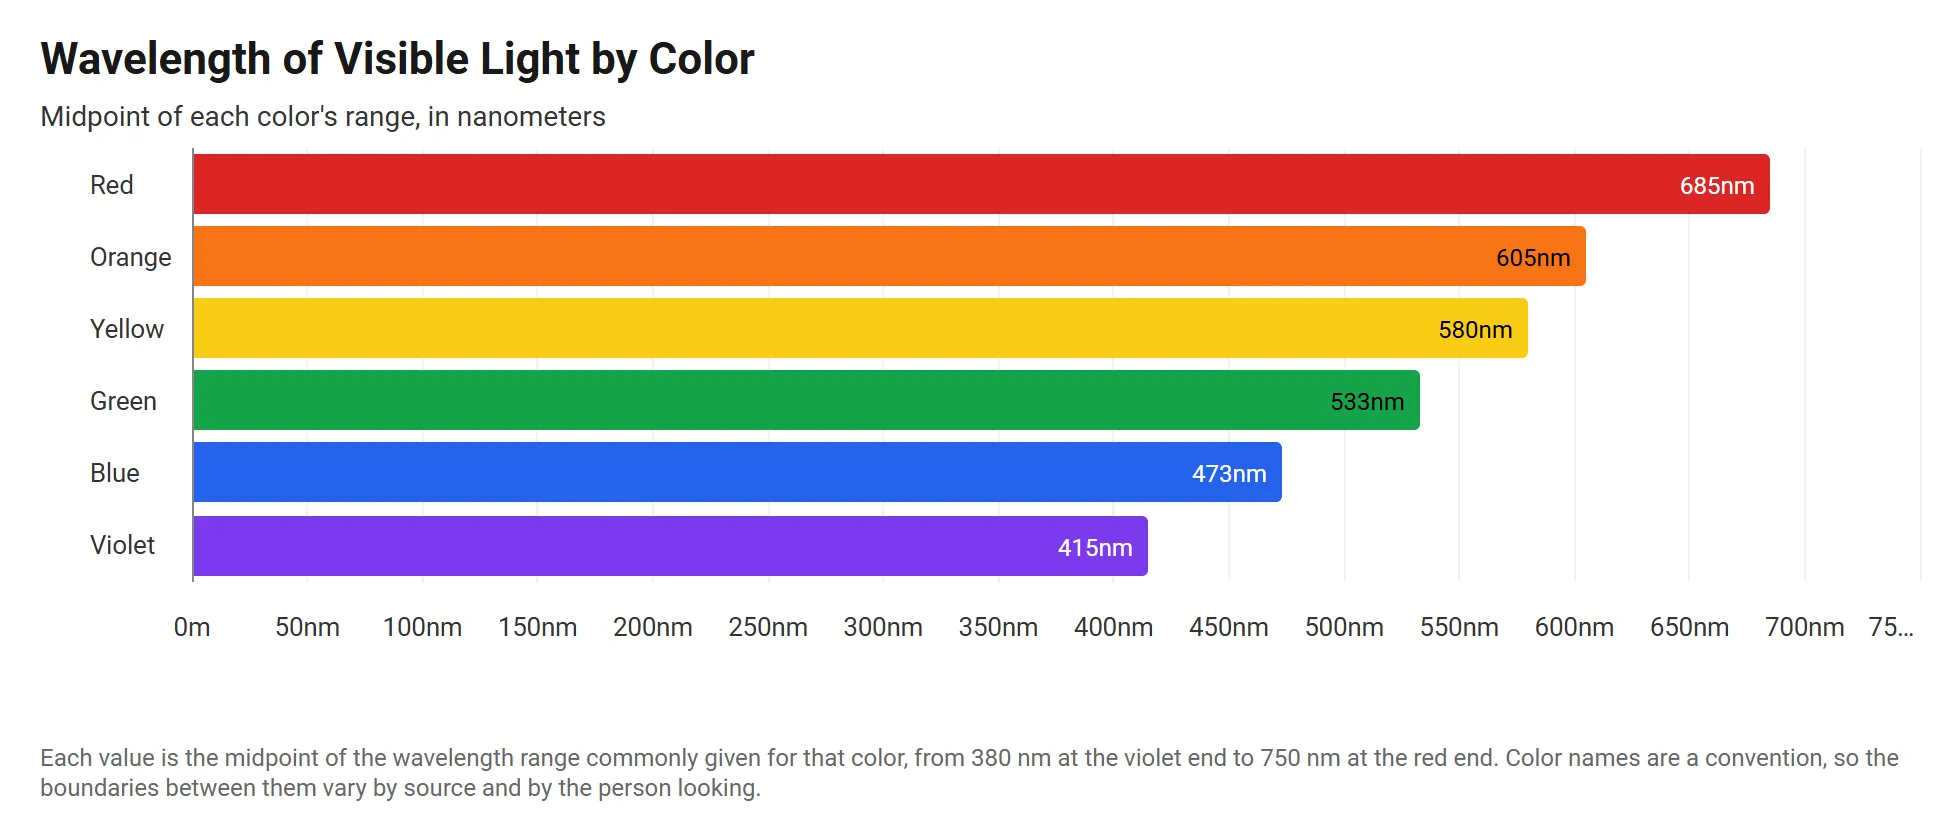 Horizontal Stacked Bar Chart
Visible Light Wavelengths by Color
The wavelength of each color in the visible spectrum, in meters, drawn as horizontal bars from violet to red.
View template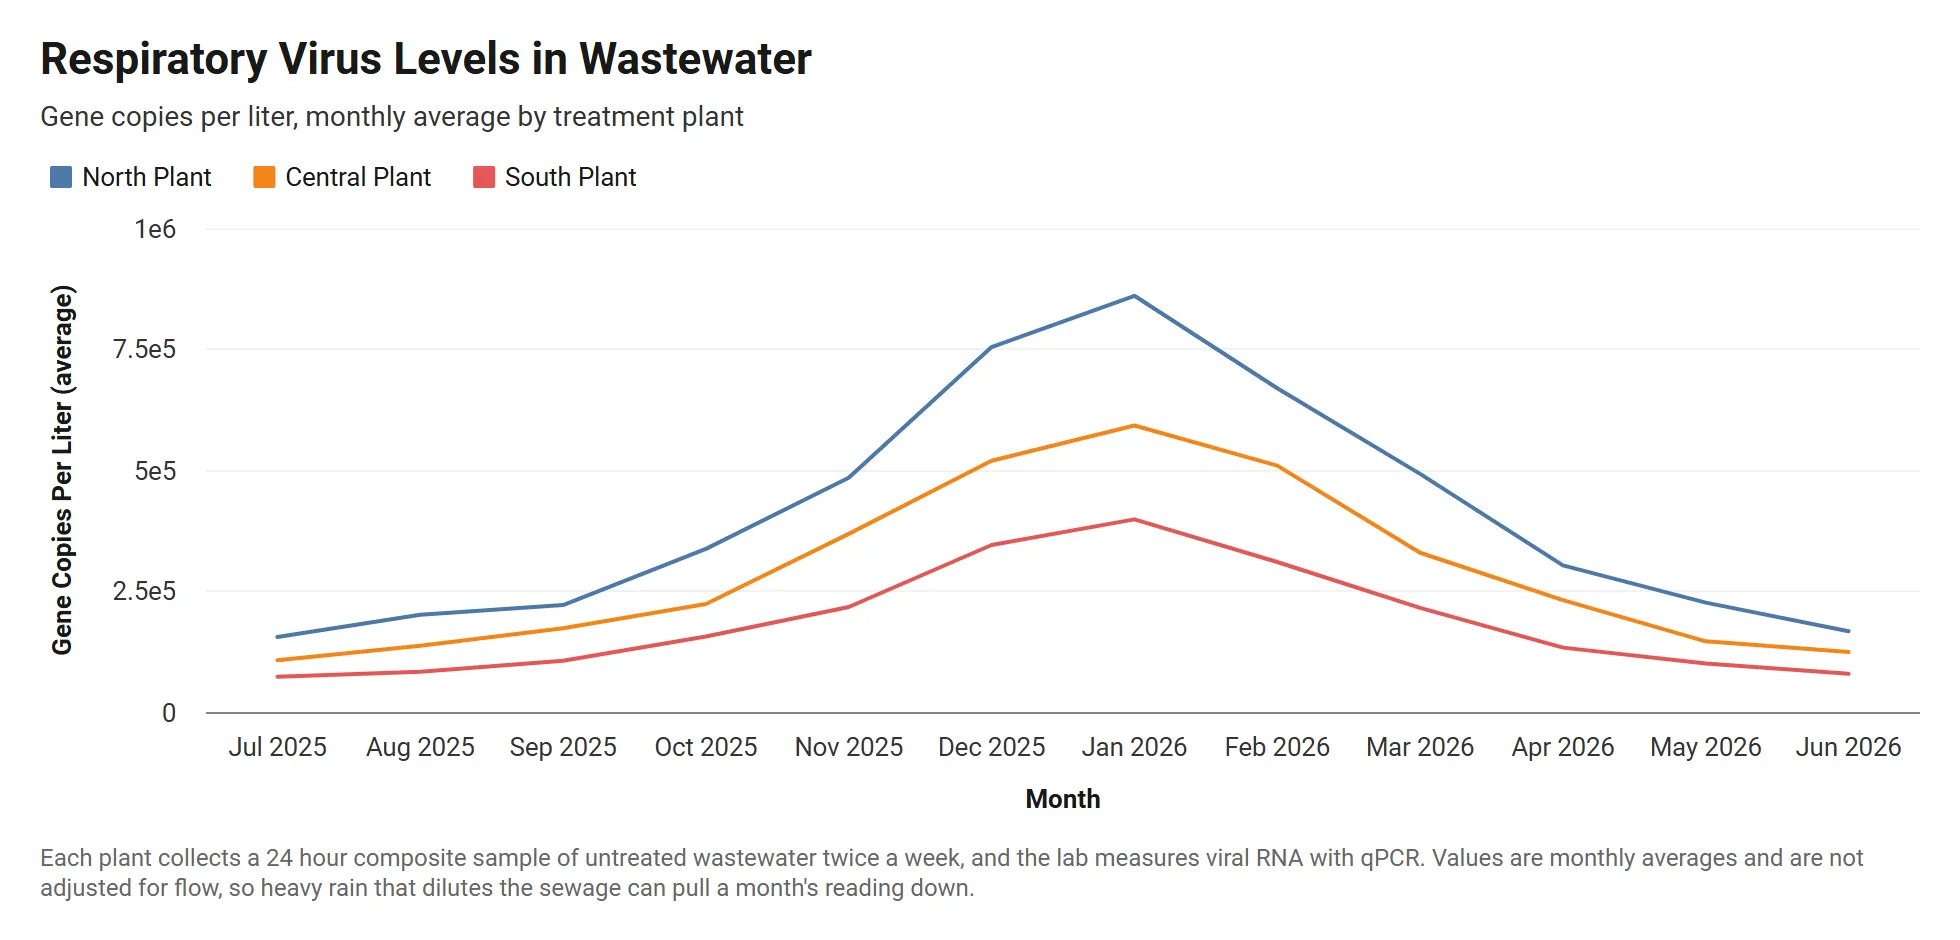 Grouped Line Chart
Wastewater Viral Load by Treatment Plant
Monthly respiratory virus levels in wastewater at three treatment plants, in gene copies per liter written in scientific notation.
View templateBrowse templates by industry
Craft professional charts in seconds
InstaCharts makes data visualization easy, so you can build clear reports without design experience.