
Trends Over Time templates
Trend Chart Templates
10 free templates you can edit online
Trend charts show how a number moves over days, weeks, months or quarters. These templates use line, area, bar, scatter and waterfall charts for time series from marketing, finance, HR, customer surveys and lab work.
- 10 templates
- Real sample data
- No account needed
Net Promoter Score Trend
Trends Over Time
Trend Chart Templates
Each template opens in the InstaCharts chart maker with its sample data loaded. Replace the rows with your own numbers, then export, share or embed the chart.
 Line Chart
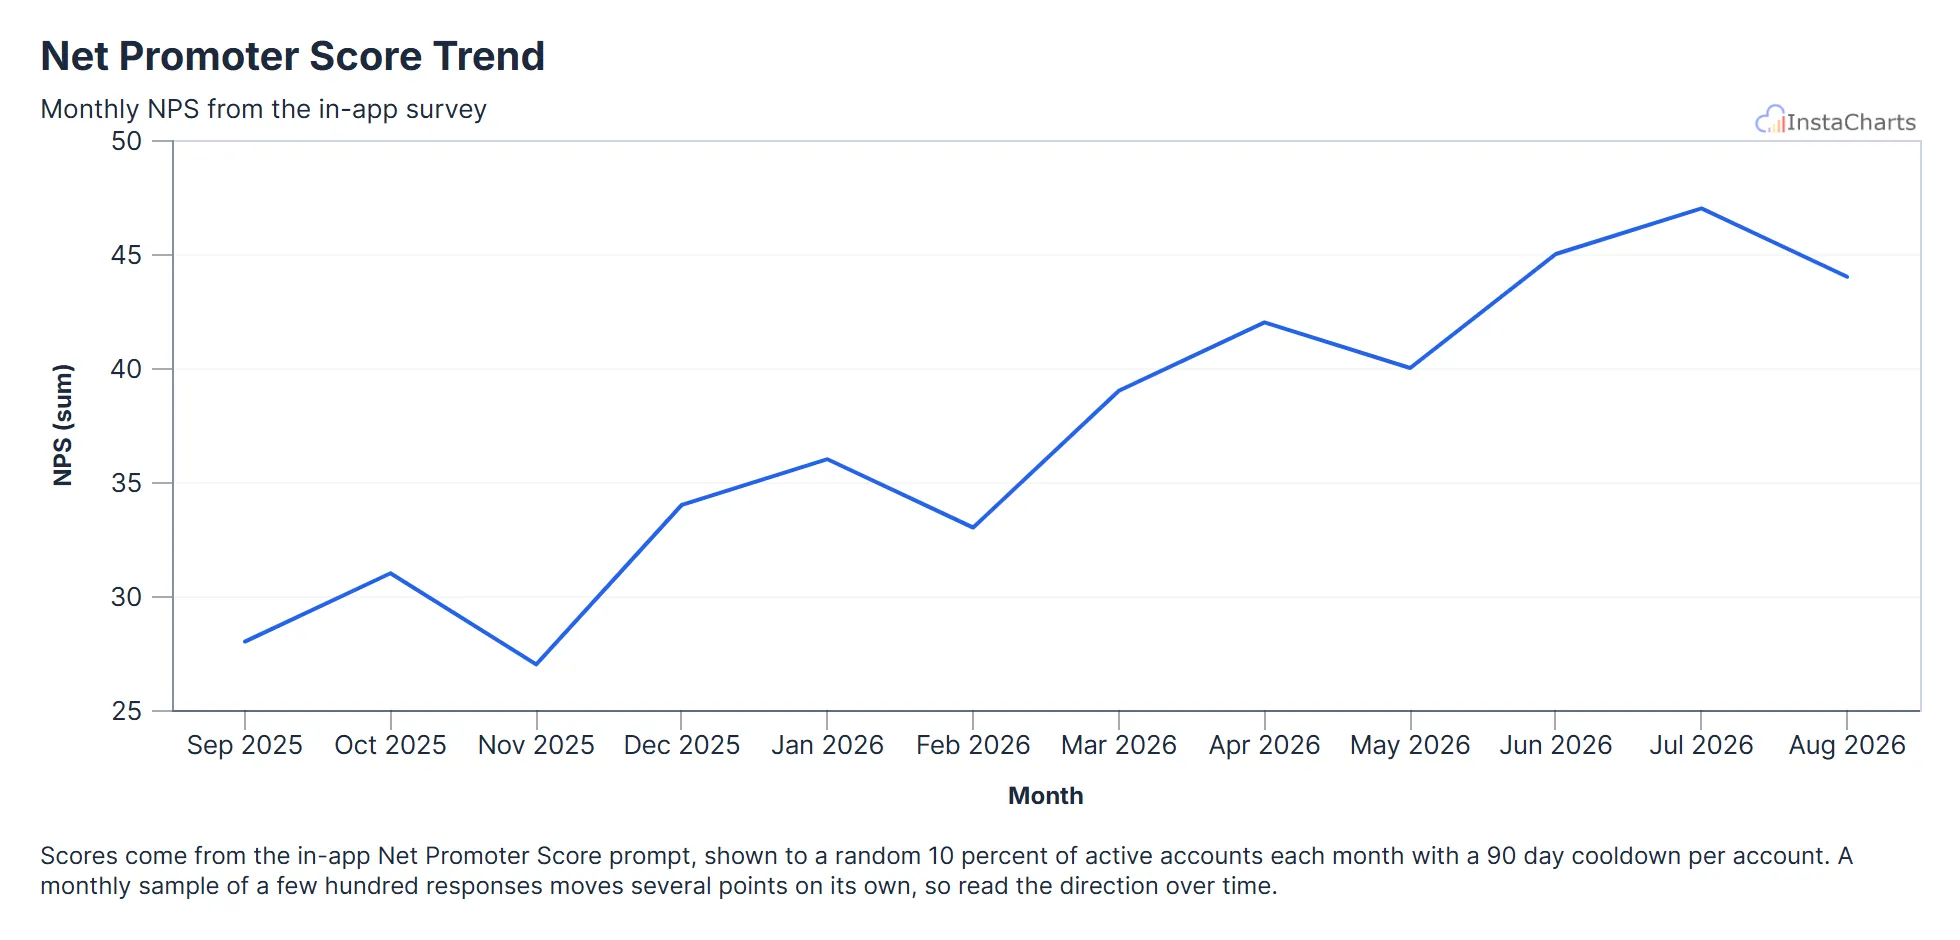
Net Promoter Score Trend
Net Promoter Score from the in-app survey for each month over the last year.
View template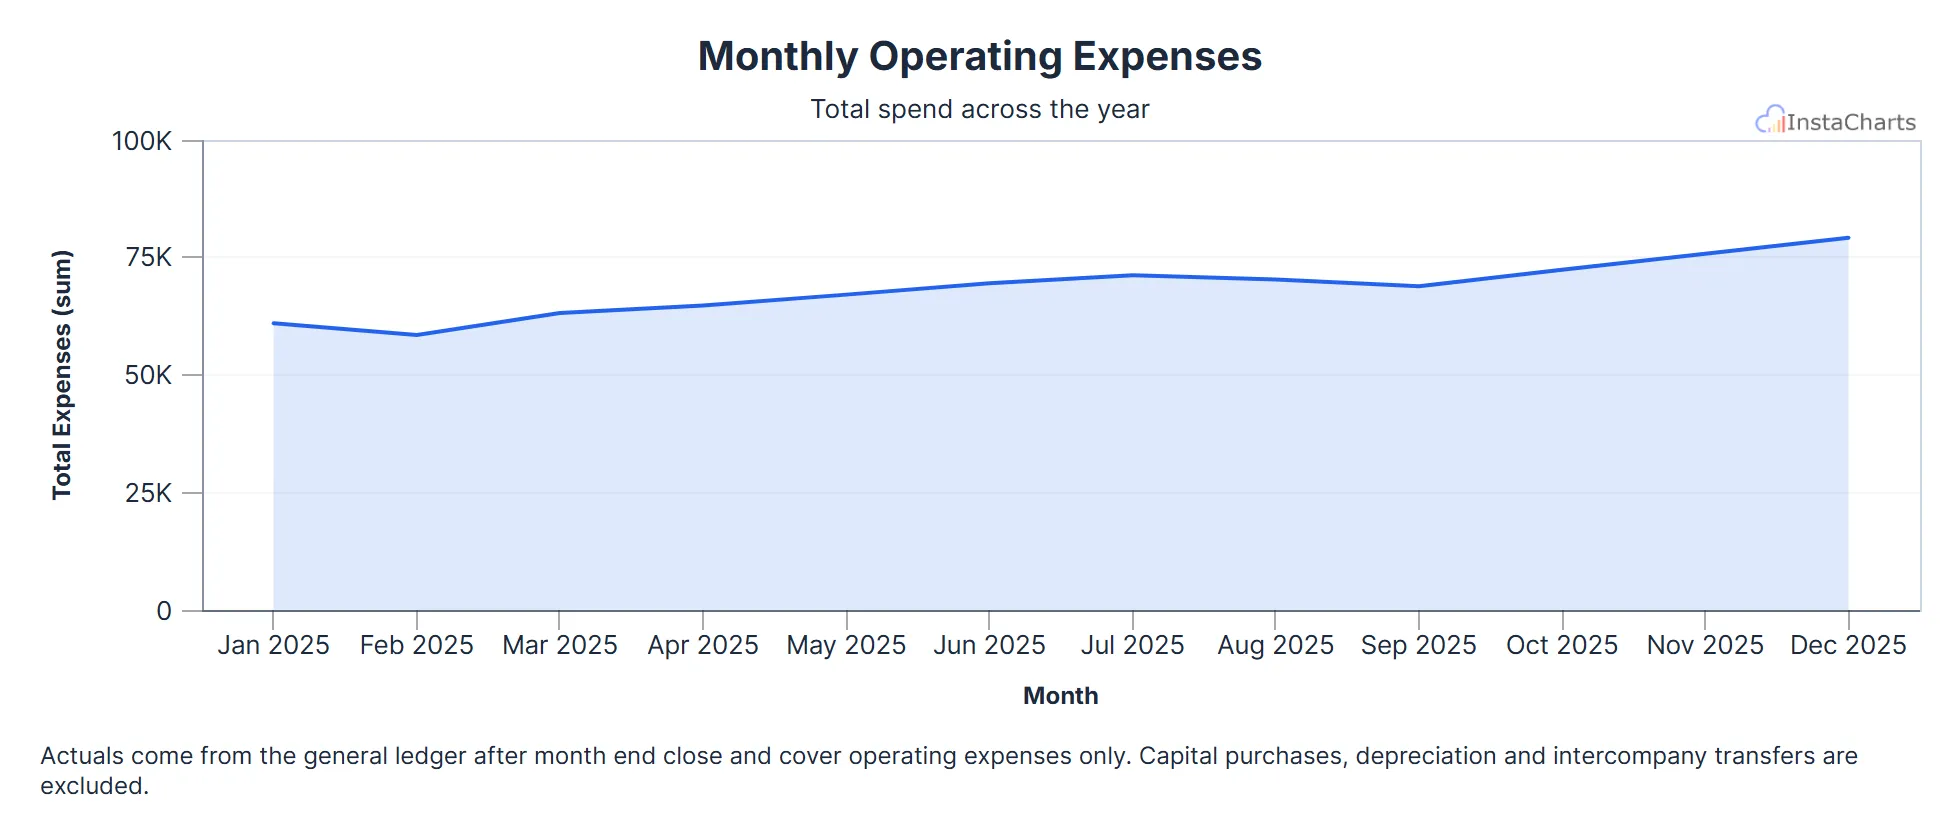 Area Chart
Monthly Operating Expenses
Total operating expenses for each month over a full year.
View template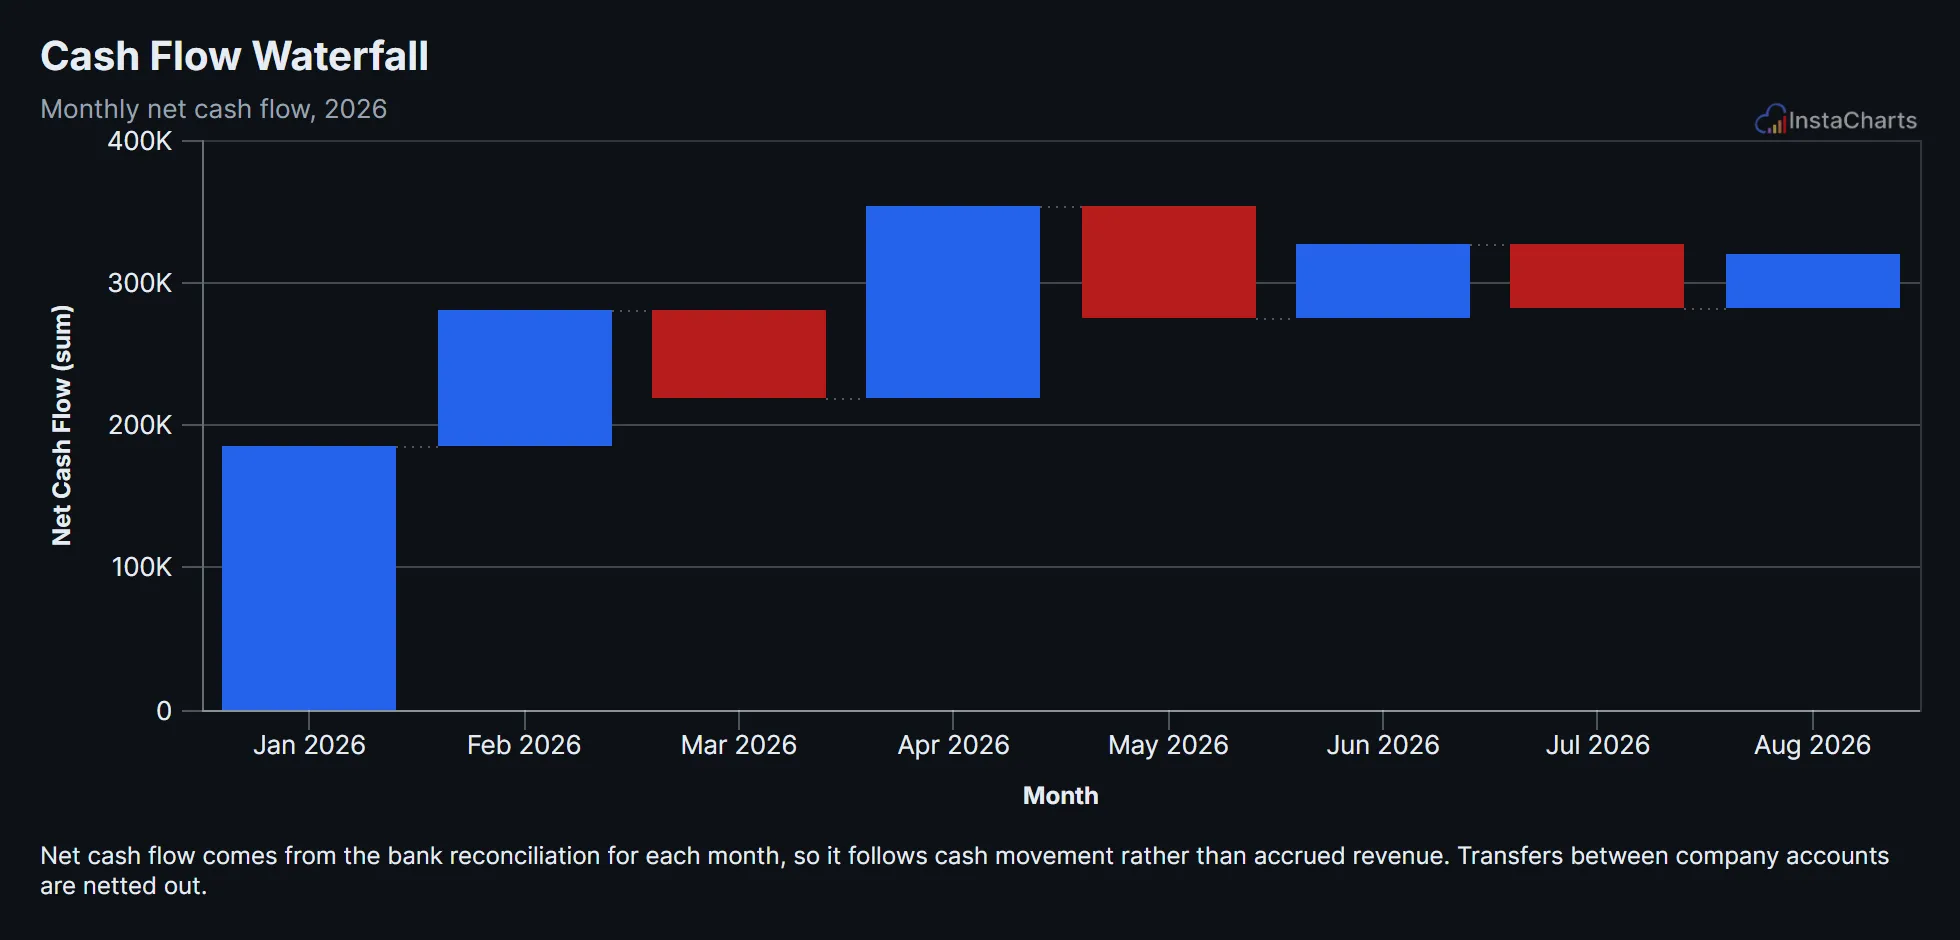 Waterfall Chart
Cash Flow Waterfall
Net cash flow for each month of the year, shown as a waterfall of rises and drops building toward the ending balance.
View template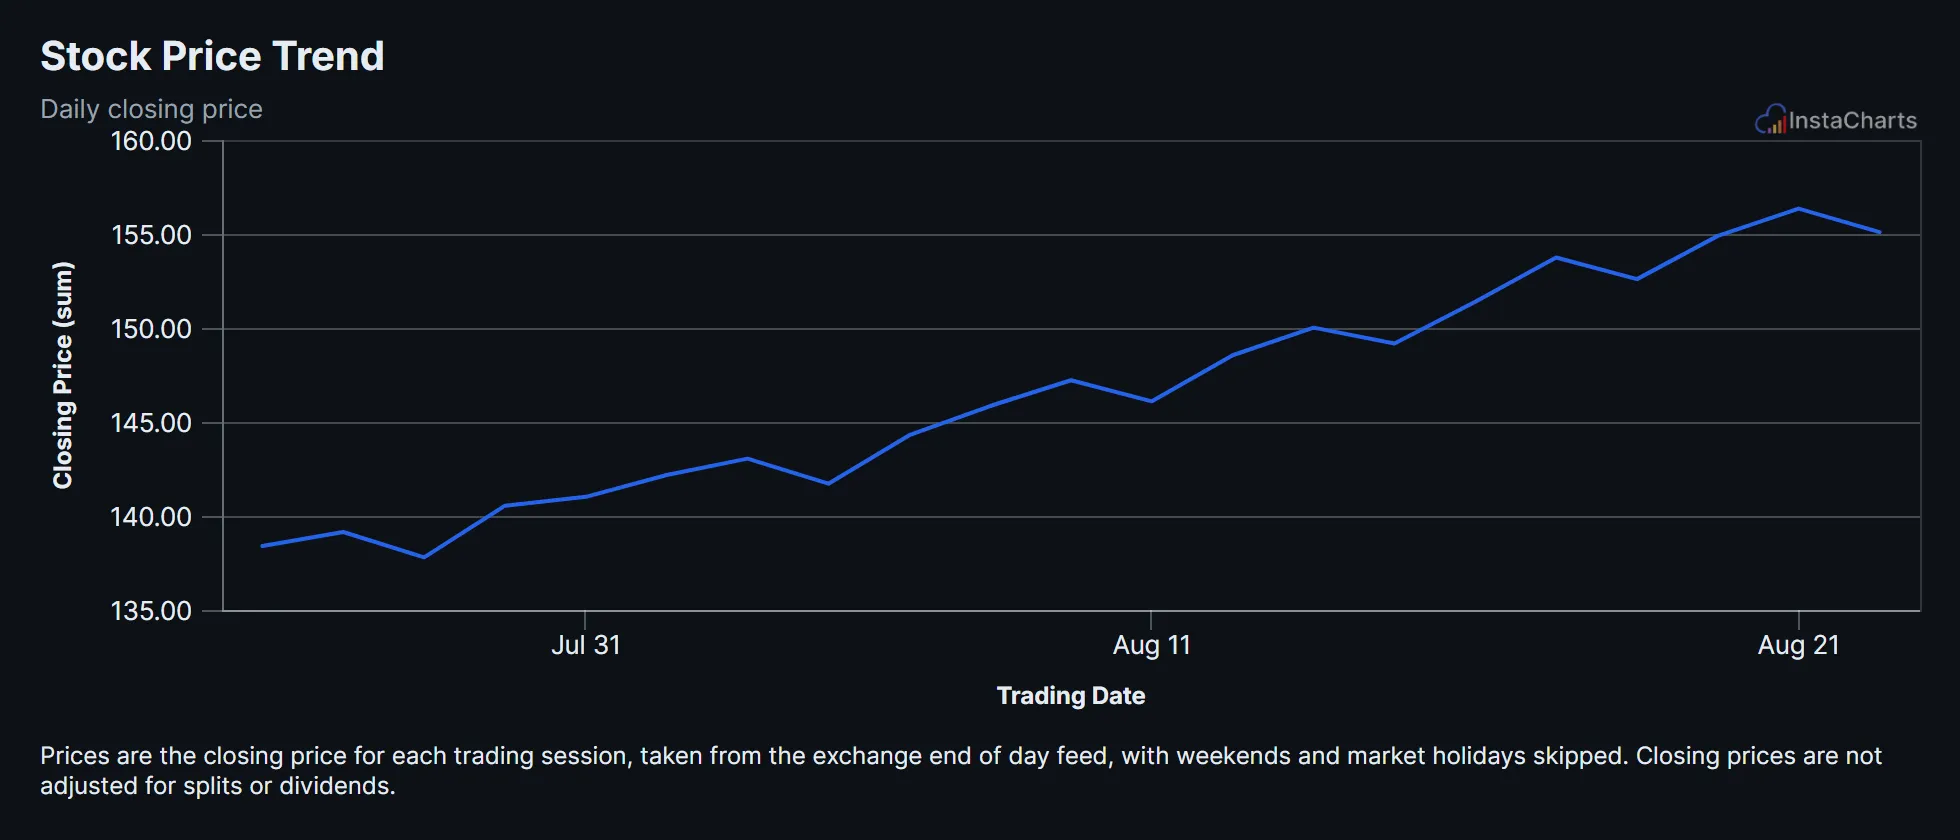 Line Chart
Stock Price Trend
Daily closing price for a sample stock ticker over several weeks of trading.
View template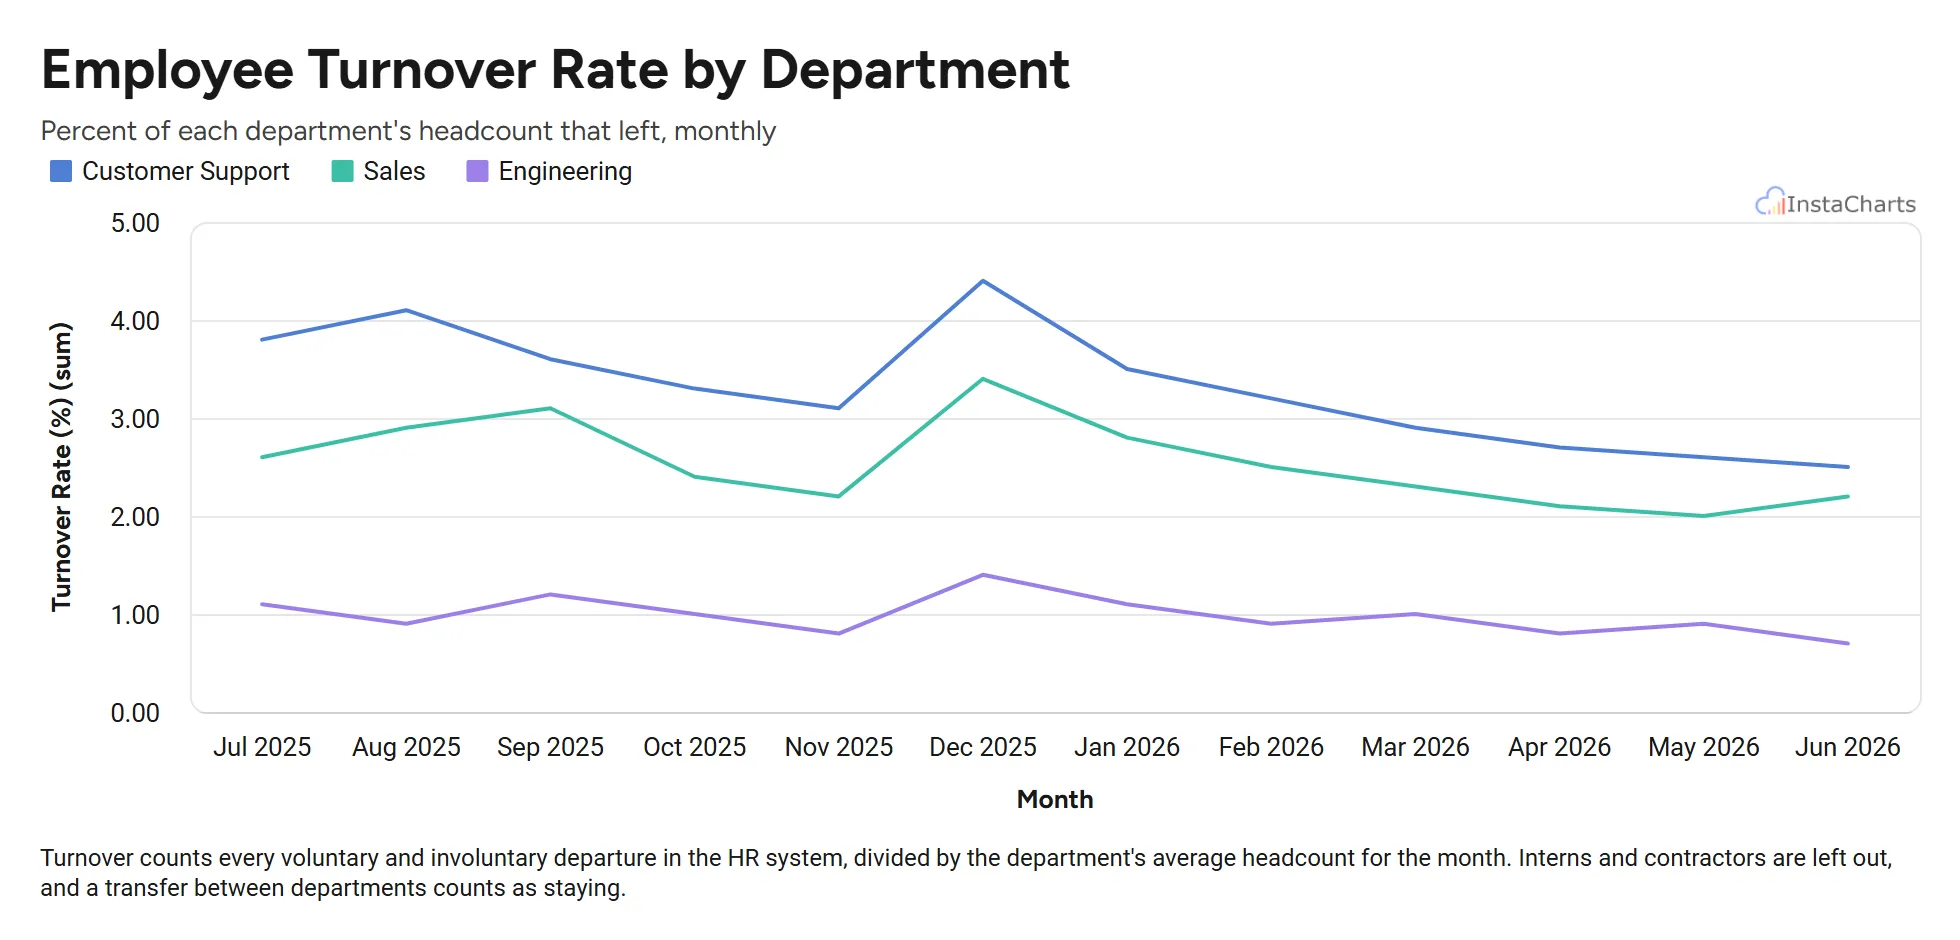 Grouped Line Chart
Employee Turnover by Department
Monthly employee turnover rate for sales, engineering and customer support over twelve months.
View template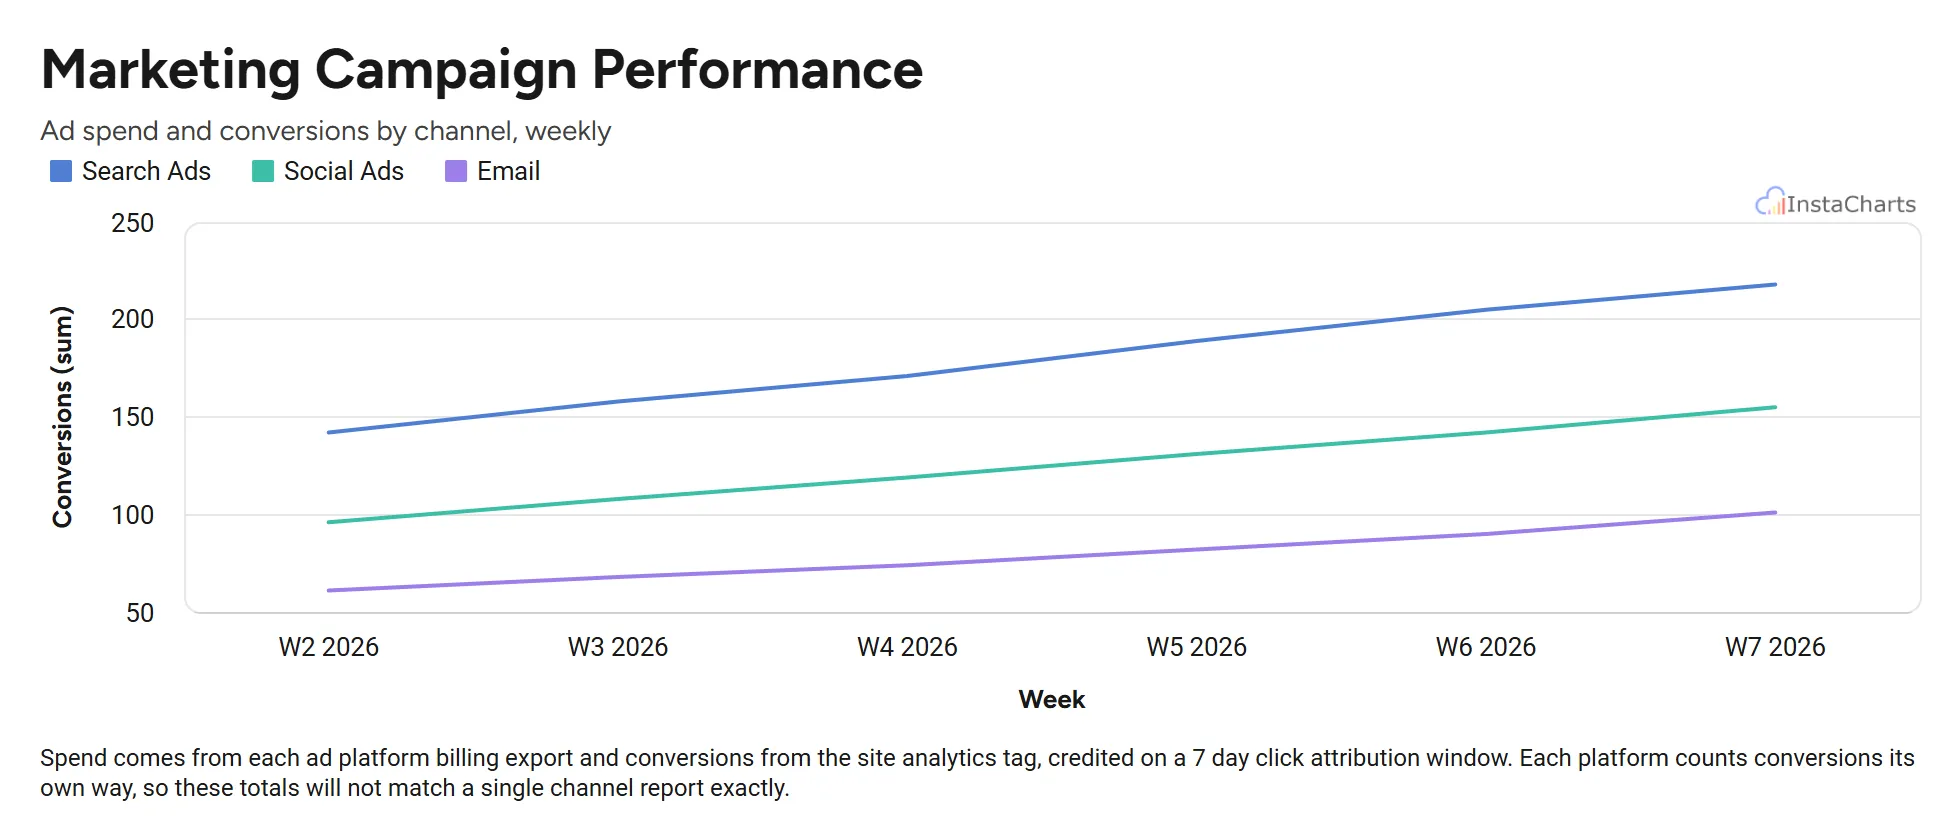 Grouped Line Chart
Marketing Campaign Performance
Weekly ad spend and conversions for search, social and email campaigns over a six week period.
View template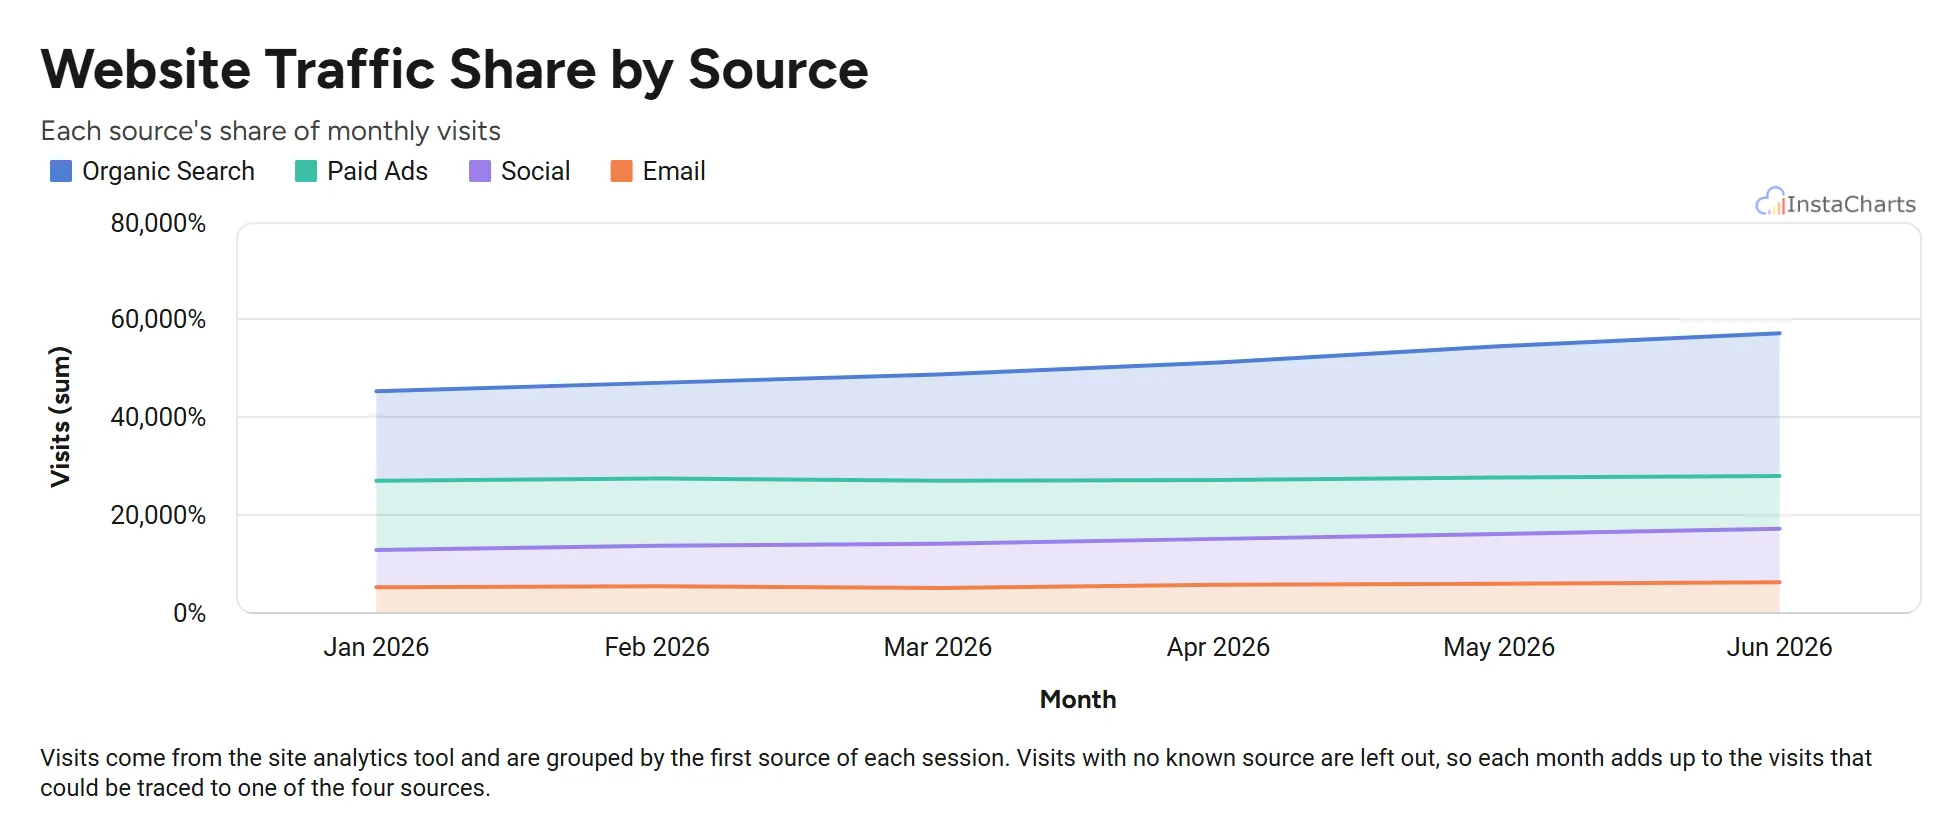 100% Stacked Area Chart
Website Traffic Share by Source
Monthly website visits from organic search, paid ads, social and email, scaled to 100 percent to show how the mix of sources shifts.
View template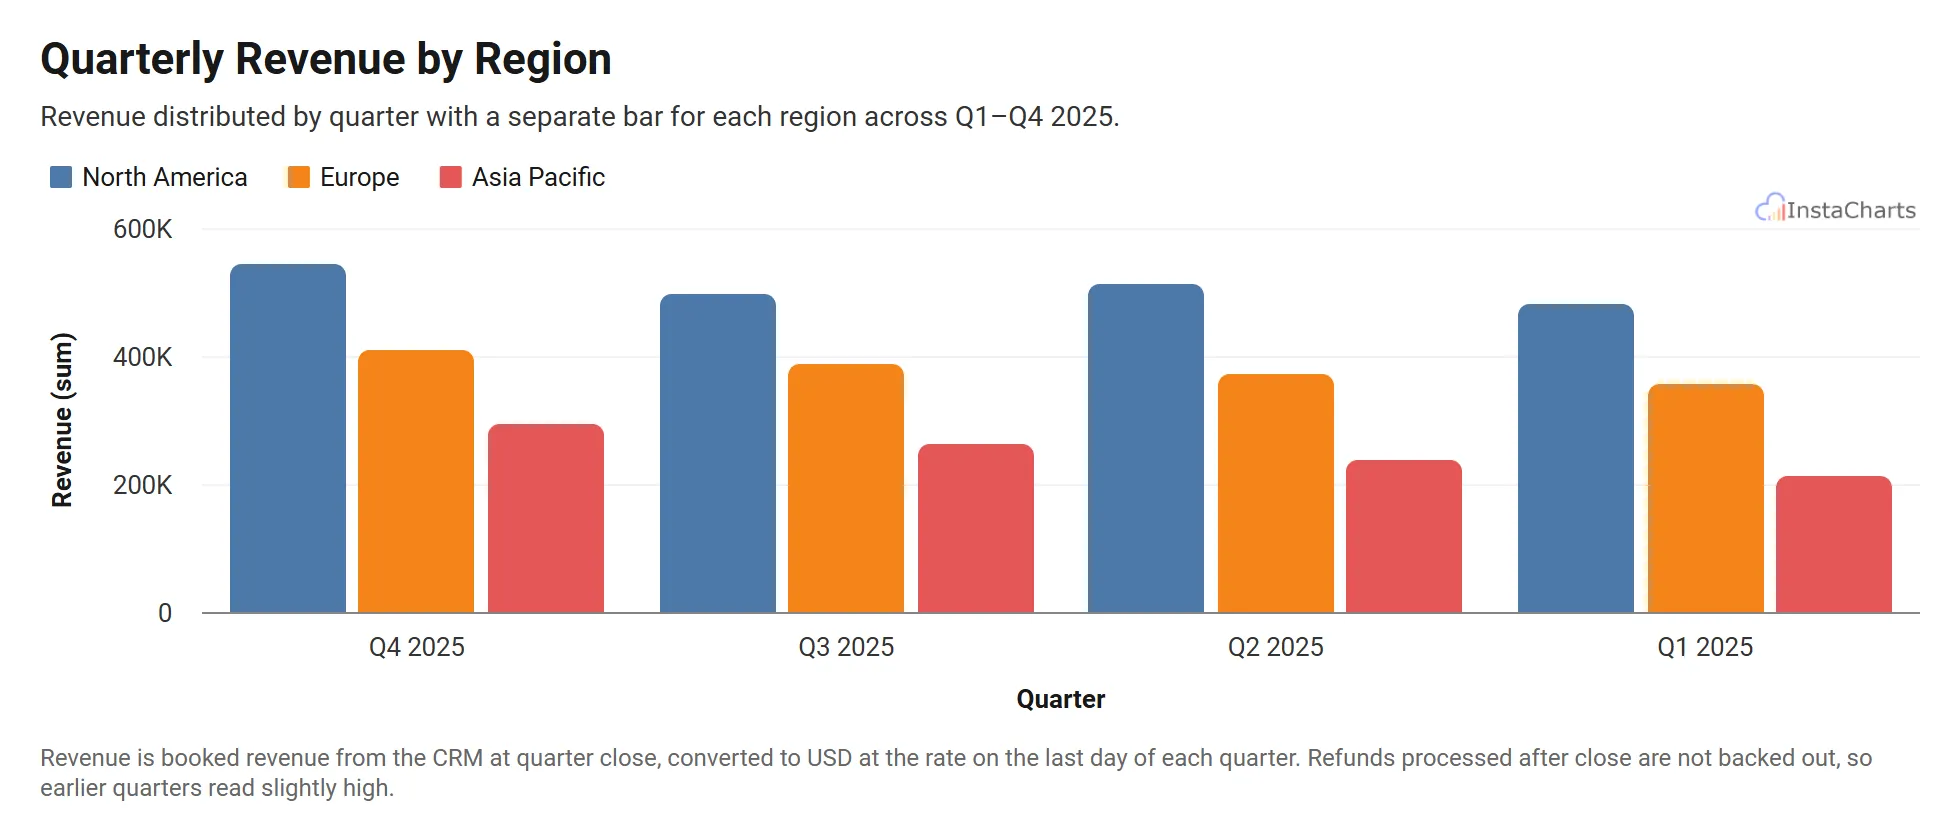 Grouped Bar Chart
Quarterly Revenue by Region
Revenue across North America, Europe and Asia Pacific for four quarters.
View template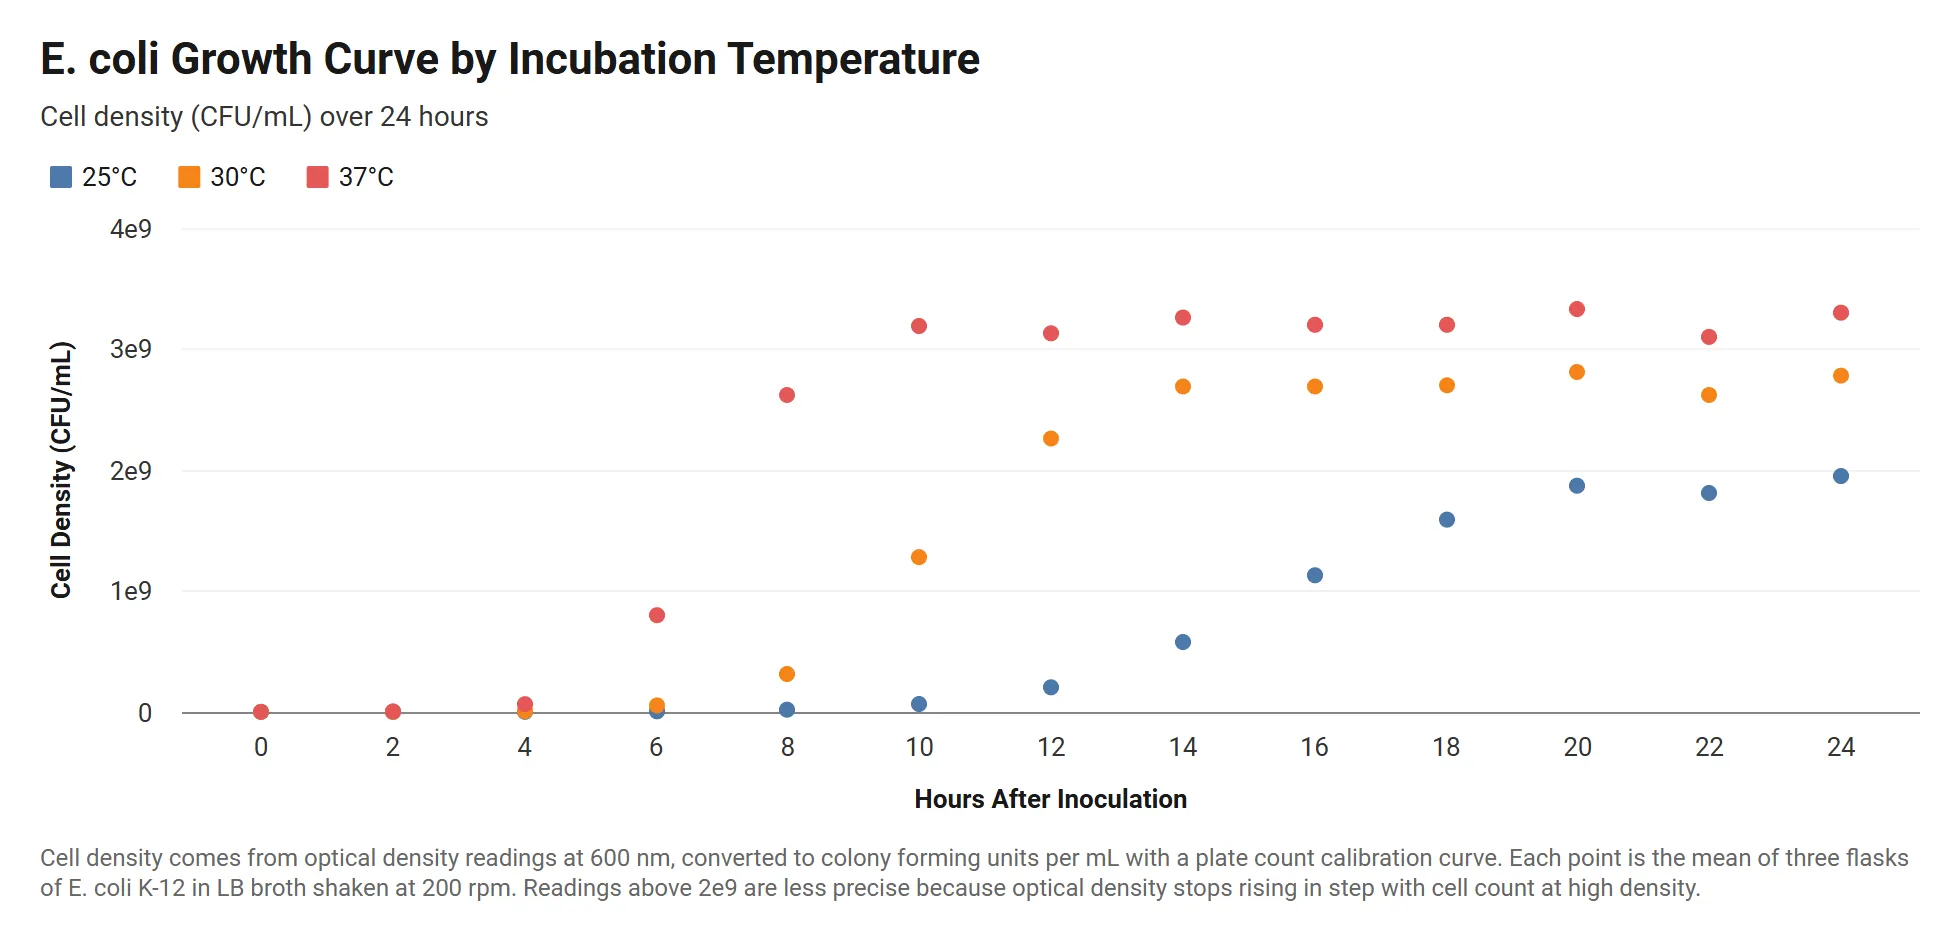 Grouped Scatter Plot
Bacterial Growth Curve by Temperature
E. coli cell density over 24 hours at three incubation temperatures, with readings written in scientific notation.
View template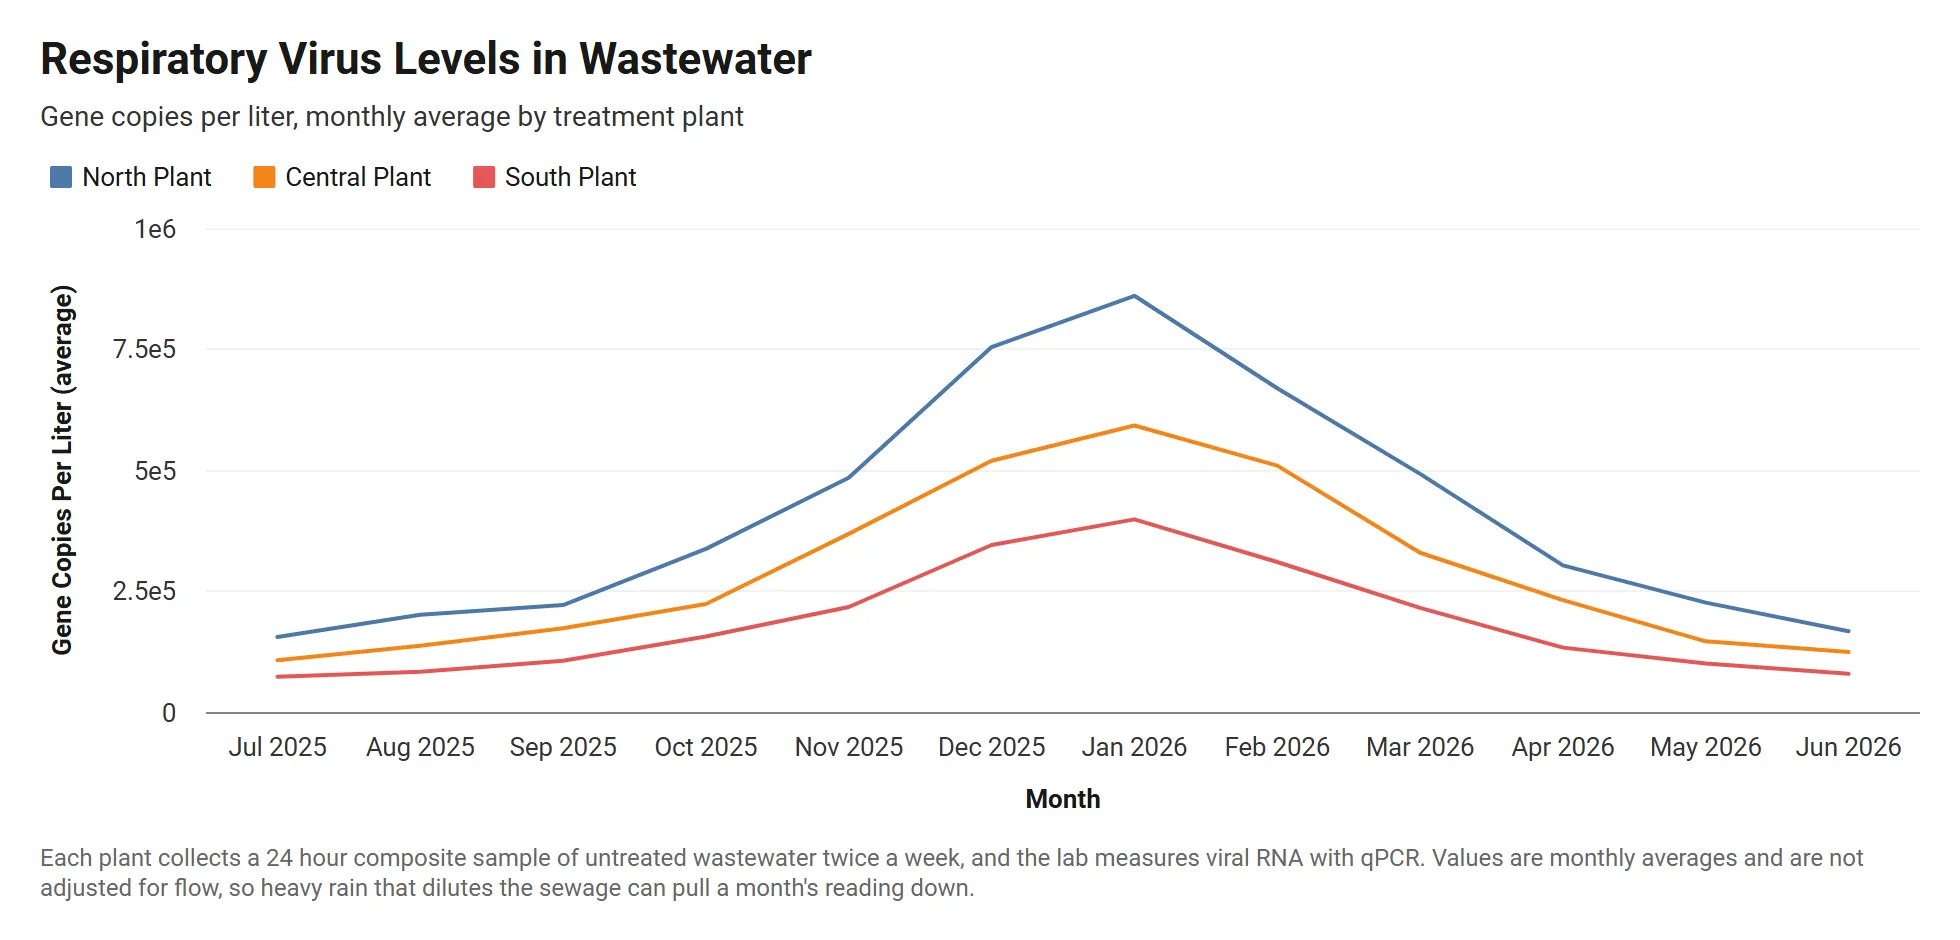 Grouped Line Chart
Wastewater Viral Load by Treatment Plant
Monthly respiratory virus levels in wastewater at three treatment plants, in gene copies per liter written in scientific notation.
View templateBrowse templates by industry
Craft professional charts in seconds
InstaCharts makes data visualization easy, so you can build clear reports without design experience.