
data tables
Transform Your Data with InstaCharts Interactive Tables
Turn static spreadsheets into interactive tables. InstaCharts DataTables help you explore, analyze, and share your data with filtering, sorting and editing tools.

Interactive
See your data more clearly
Every InstaCharts data table is interactive, like the live embedded table shown here. Try sorting and filtering it.
Sort Any Column
Click a column header to rank rows from highest to lowest or from A to Z.
Filter & Search
Search every column with the quick filter, or add column filters for text, numbers and dates.
Full Dataset & Plotted Data
Switch between every row in your sheet and only the data behind your chart.
MTA NYC Subway Train Delays 2026
LiveFeatures
Key Data Table Features
Bring in data from any spreadsheet, put it on your website and see who is viewing it.
Upload Any File
Explore the data in Excel, CSV, PSV, TSV, log, JSON and JSON Lines files, or connect a Google Sheet.
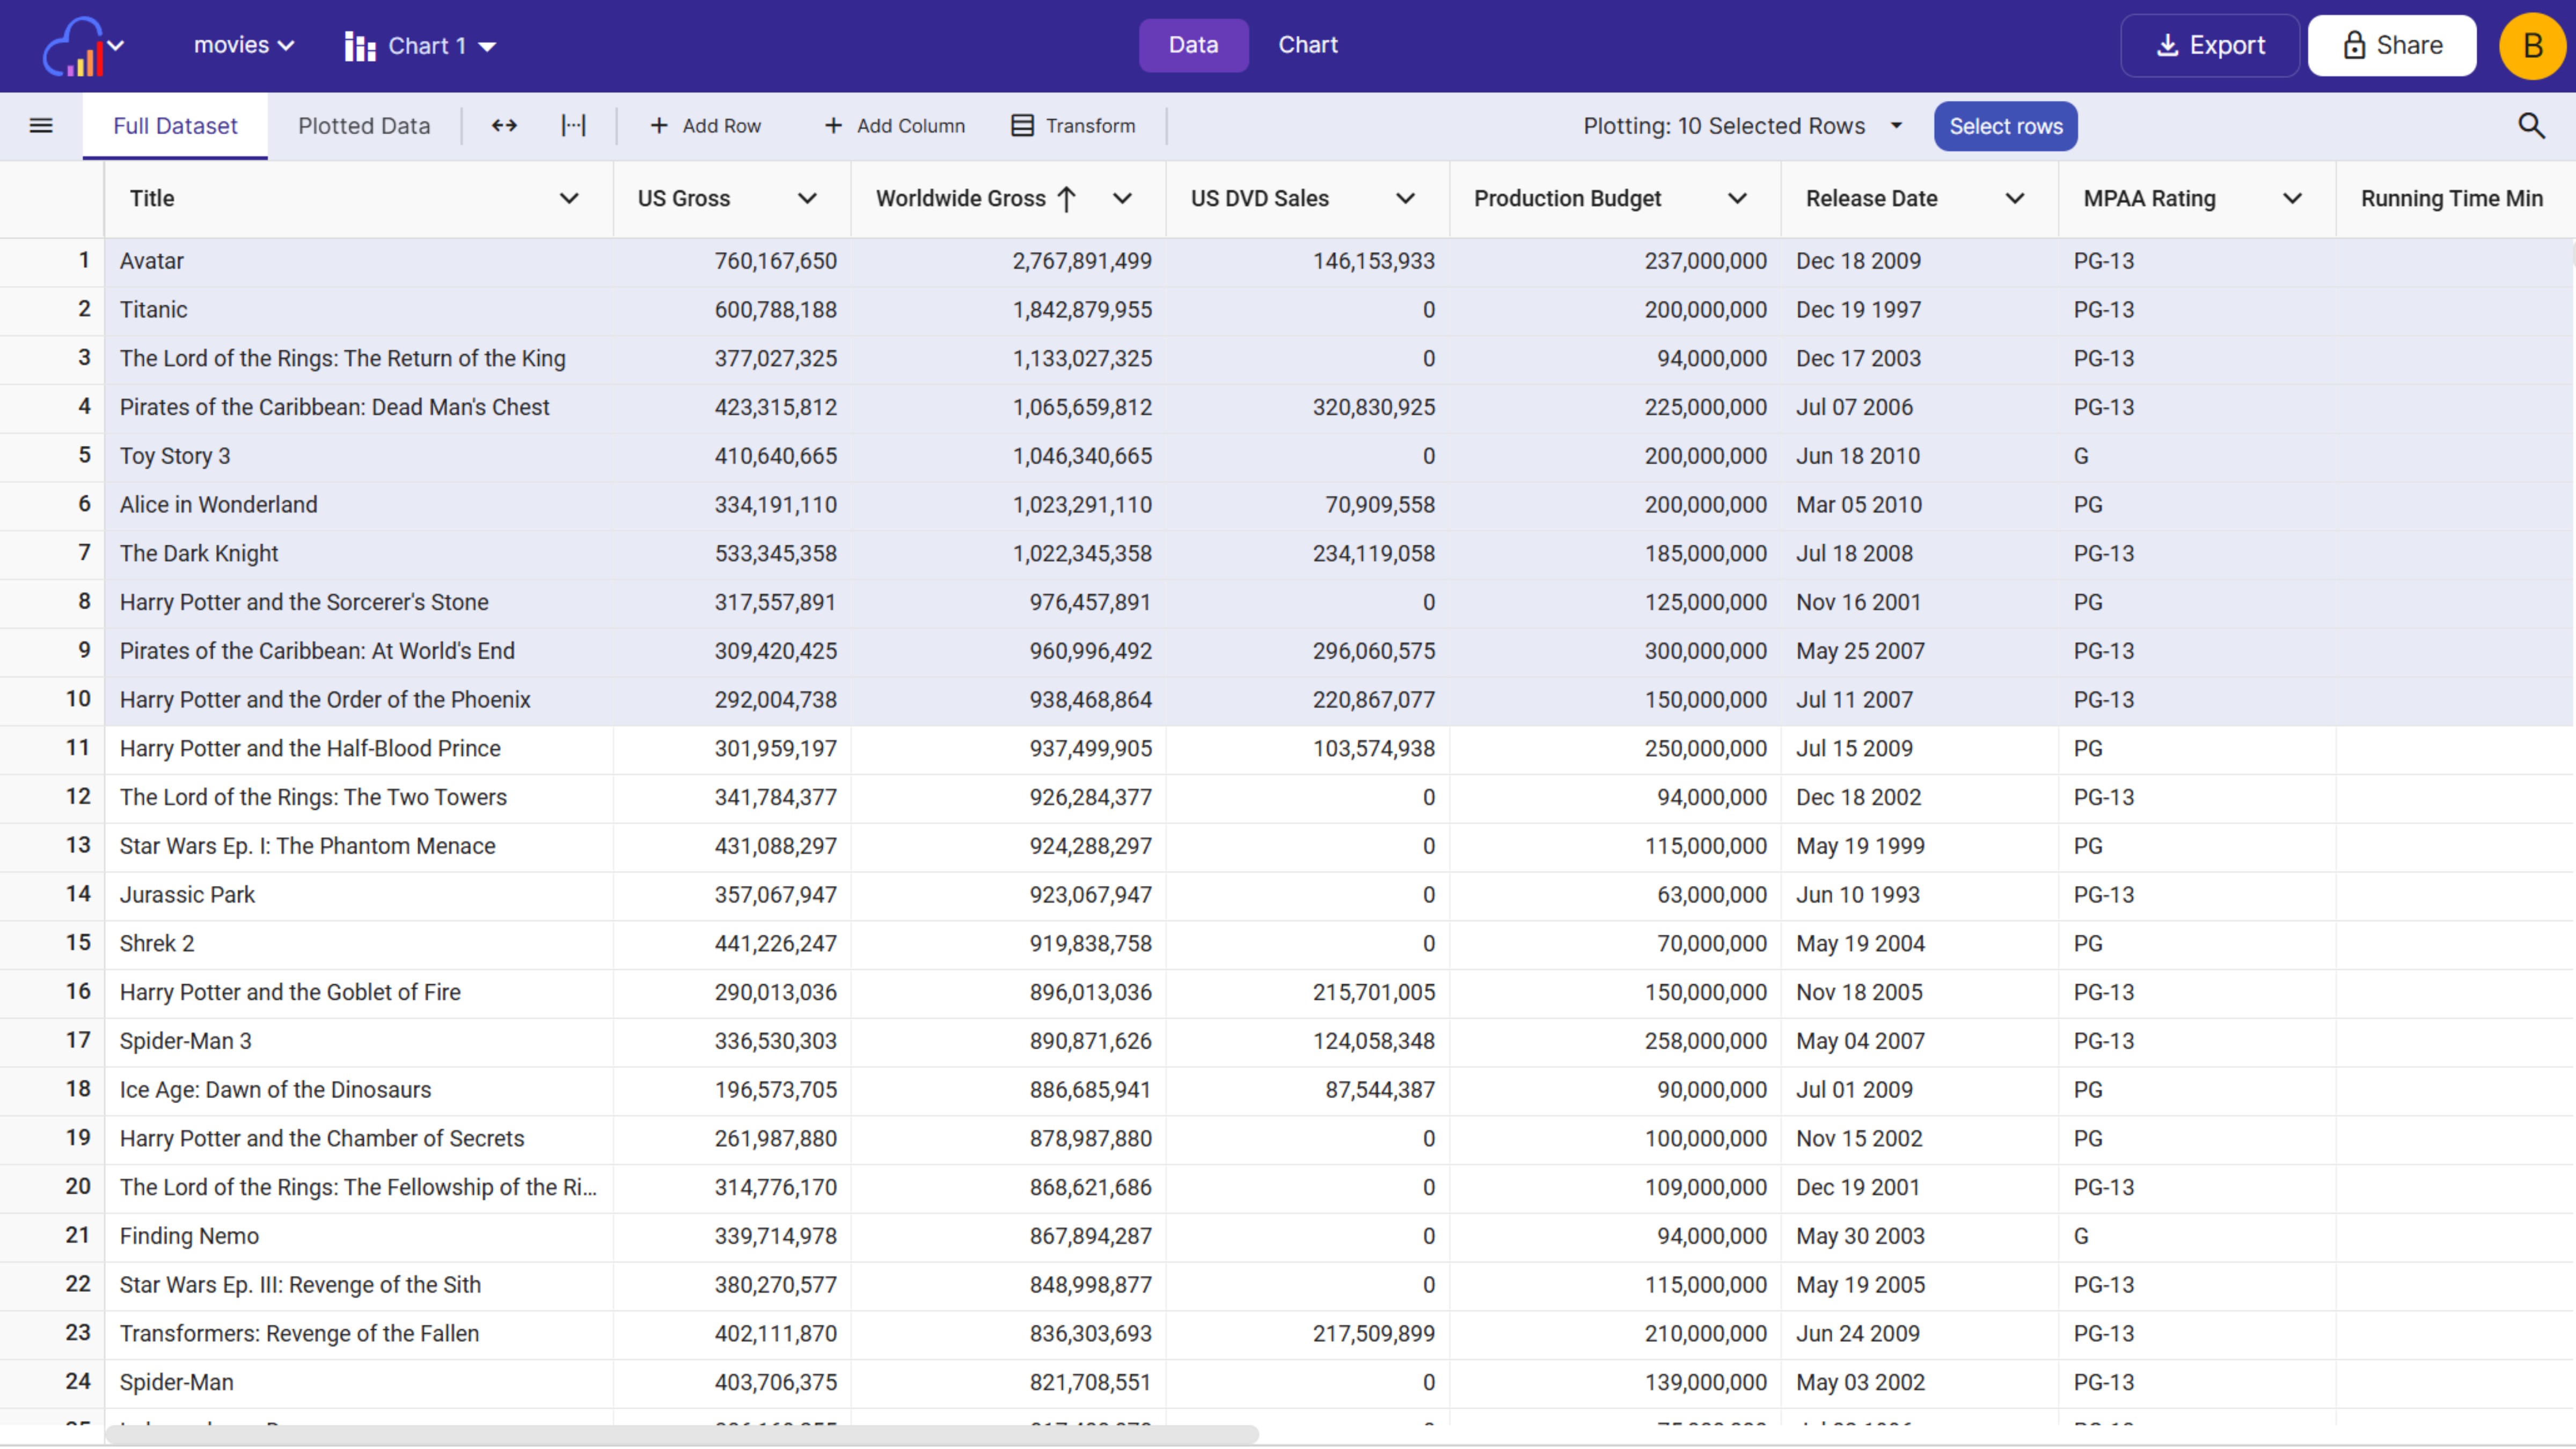
Select Rows to Plot
Pick exactly which rows a chart plots right from the data table, or plot every row.
Export Your Data
Download the table as a CSV, Excel, TSV or JSON file, or export only the rows you select.
Embed Online
Embed a sortable, filterable table in WordPress, Webflow, Squarespace or any HTML page, responsive or at a fixed size.
Share Analytics
See how many people opened your shared data table and which pages on the web are loading your embed.
Whitelist Domains
Choose which domains and subdomains are allowed to load your embedded tables.
Edit
Edit and clean your data
Fix mistakes and tidy up raw data right in the table, without going back to a spreadsheet program.
Cells, Rows & Columns
Edit any cell, add or delete rows, and add, rename or delete columns.
Find & Replace
Replace values across a column or the whole sheet, or paste copied text with Paste Special.
Smart Column Types
InstaCharts detects each column type and recommends one you can change at any time.
Transform
Reshape your data in a few clicks
Transforms reorganize a table so it is ready for charts, reports and dashboards.
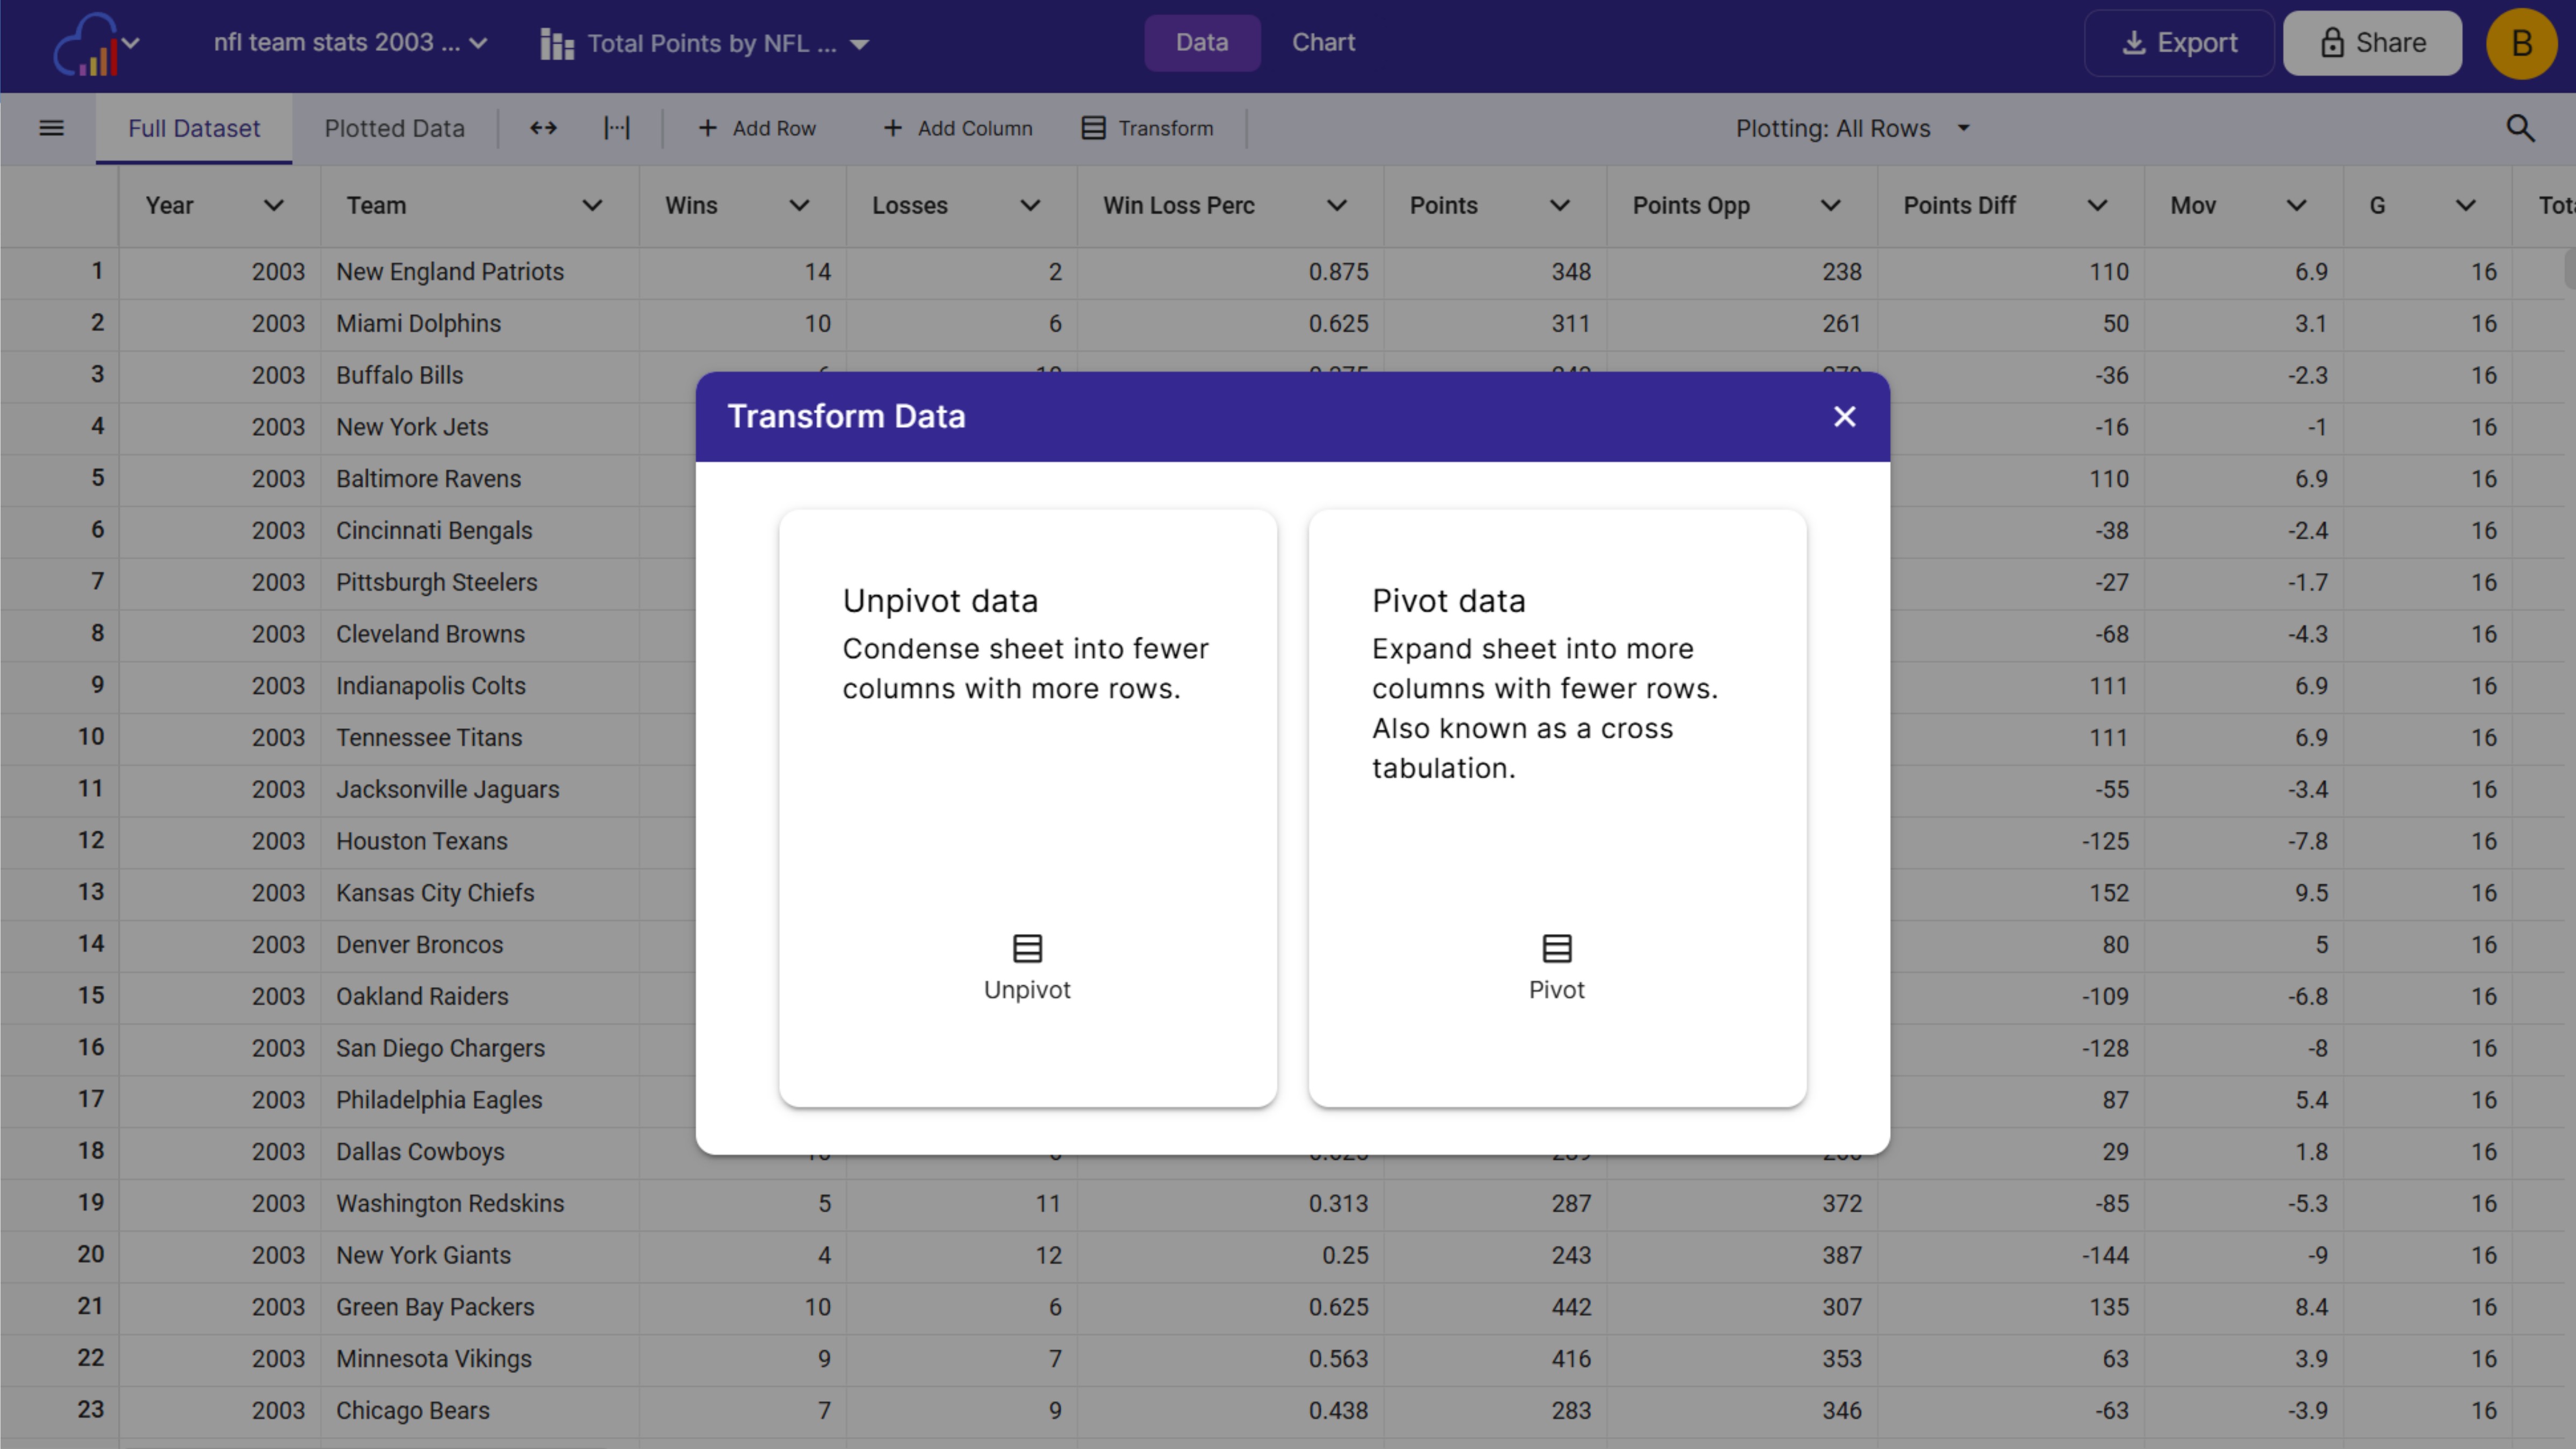
Pivot & Unpivot
Expand a sheet into more columns as a cross tabulation, or condense it into fewer columns with more rows.
Split & Merge Columns
Split one column into several, or merge several columns into one.
Expand JSON Columns
Split a column of JSON objects into separate columns, keeping only the fields you need.
Sync
Keep your tables up to date
Shared and embedded tables show your newest data at the same URL, so the links you already shared keep working.
Google Sheets & Drive
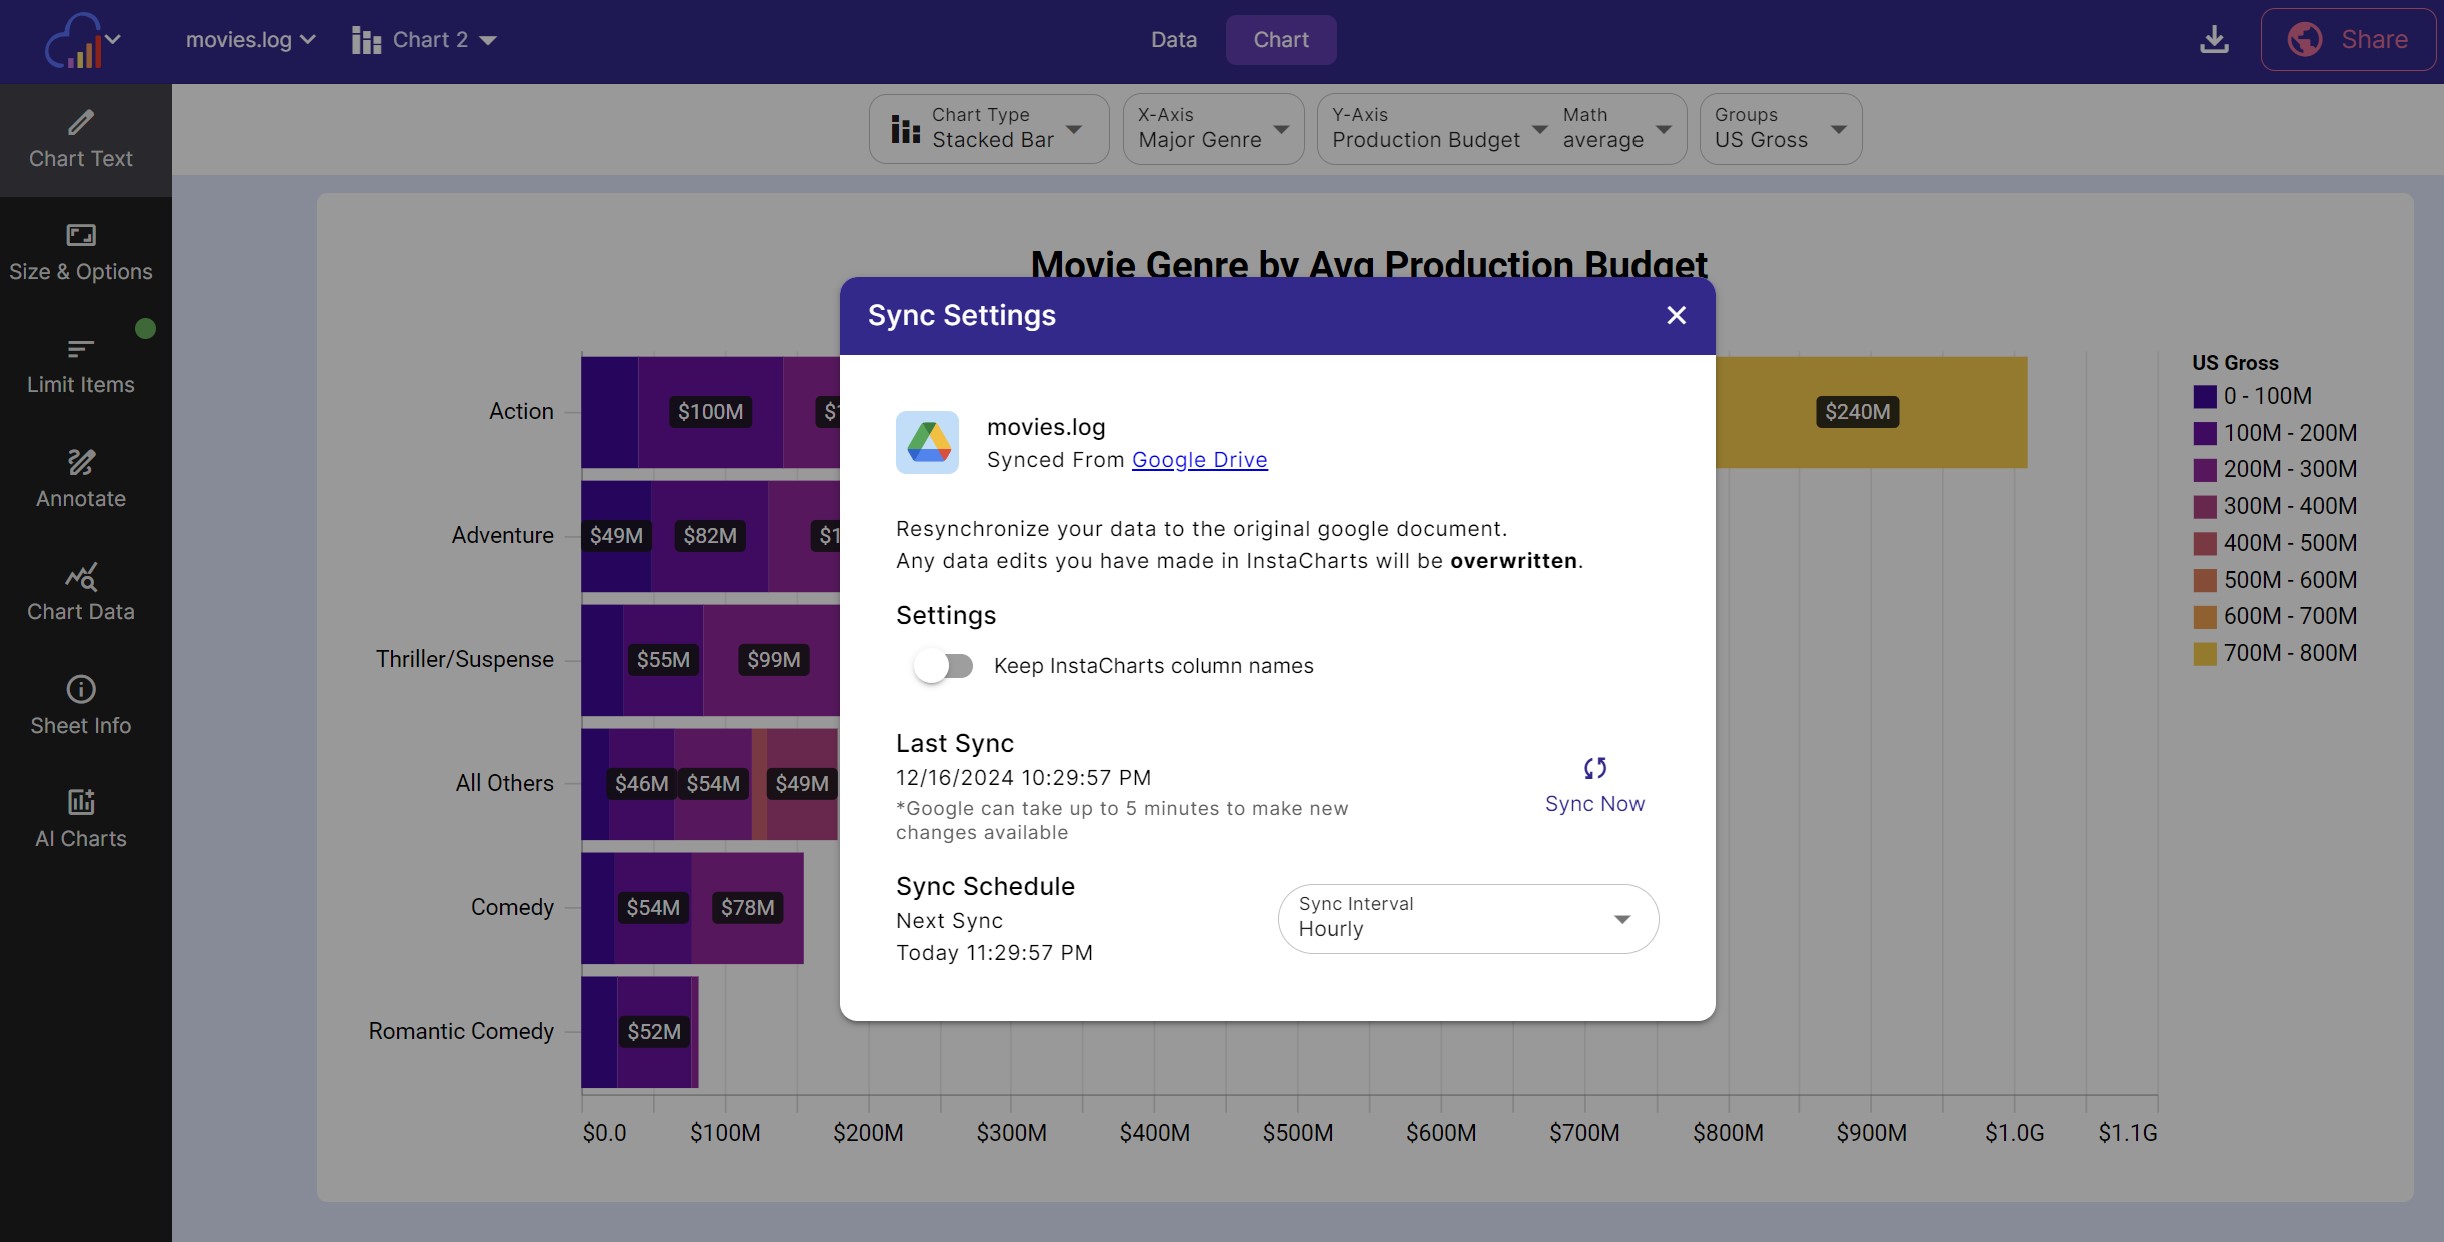
Connect a Google Sheet or Google Drive file and refresh it any time with Sync Now.
Sync Schedule
Refresh hourly, daily, weekly, monthly or whenever the original file changes.
Update From a File
Overwrite the data, append rows or add columns with a newer file from your device.
FAQs
Data Table FAQs
An interactive data table is a table on the web that viewers can sort, filter and search. InstaCharts turns a spreadsheet into an interactive data table you can share with a link or embed on your website, so your audience can explore the numbers on their own.
Upload a CSV, Excel, TSV, PSV, JSON, JSON Lines or log file, or connect a Google Sheet or Google Drive file. InstaCharts detects text, numbers, currencies and dates in each column and displays your data in a sortable, filterable data table right away.
Open the share window for your data table and copy the embed code, then paste it into WordPress, Webflow, Squarespace or any HTML page. The embedded table stays interactive, so visitors can sort and filter it on your site. Embed views are limited based on your InstaCharts plan.
Yes. In the share dialog you can make the embed responsive or set a fixed width and height in pixels, choose the background and border, and copy either the full embed tag or the iframe only. You can also style the embed toolbar and data table to match your embedded chart.
Use the quick filter to search across every column at once, or add column filters to narrow the table by text, number and date values. Combine filters on several columns to show only the rows you need.
The Full Dataset tab shows every row and column in your sheet. The Plotted Data tab shows the data behind the current chart, so you can check which numbers the chart is drawing.
Yes. Switch the plotting setting from All Rows to Selected Rows, click Select rows, and pick the rows you want in the data table. Save the selection and the chart plots only those rows.
Yes. Edit individual cells, add and delete rows, add new columns, and rename or delete columns. Use find and replace across a column or the whole sheet, or use Paste Special to paste copied text into the table. Saved edits apply to every chart built on that sheet.
InstaCharts includes data transforms for reshaping a table without a spreadsheet program. Pivot and unpivot your data, merge several columns into one, or split one column into several to prepare your data for tables and charts.
Right click a column that holds JSON objects and choose Split Object Column. InstaCharts lists the fields it finds, so you can choose which fields to keep and name each new column.
InstaCharts detects column types automatically when you upload a file, including text, numbers, currencies, booleans, IDs, multiple choice survey answers and several date and time formats across various locales. The Edit Column window shows the types found in a column and the recommended type, and you can override the type at any time.
Open the share window and turn on the public link. You can customize what is shared, such as the chart, the full dataset, the plotted data and whether editor controls are visible, and send the link to anyone who needs to see the data.
Yes. Paid plans can share a data table with specific people by adding their email addresses in the share window. Each person gets viewer access, and you can remove access at any time.
Connect your table to Google Sheets or Google Drive and set a sync schedule to refresh it automatically, hourly, daily, weekly, monthly or whenever the original file changes. For files on your device, update the sheet with a newer file to overwrite the data, append new rows or add new columns. Shared and embedded tables show the new data at the same URL.
Yes. Paid plans include share analytics for shared and embedded data tables. See total views, views over the last 30 days and a day by day or month by month trend, plus a top referring pages report that lists the URLs loading your embedded table. You can also whitelist the domains allowed to load your embeds.
Yes. Export your table data as a CSV, Excel, TSV or JSON file to use it in Excel, Google Sheets or another tool. You can export every row or only the rows you select, and copy selected cells with or without the header row.
Yes. The free plan lets you upload, explore and share data tables with up to 500 rows of data per sheet. Paid plans starting at $10 per user per month remove the row limit and add share analytics and scheduled syncing.
Transform Your Data Today
InstaCharts makes data visualization easy, so you can build clear reports without design experience.