How to create a dashboard from a spreadsheet
Create a dashboard, add your sheets, then build it out with chart, data table, KPI and text widgets.

Turn spreadsheets into a live dashboard
Spreadsheets, screenshots and slide decks make it hard to answer “how are we doing?” quickly. A dashboard puts your charts, tables, key metrics and notes on a single page that stays up to date, and InstaCharts makes building one fast and fully no-code.
TLDR: Sign up for a free account and build your first dashboard in minutes!
1. Create the dashboard
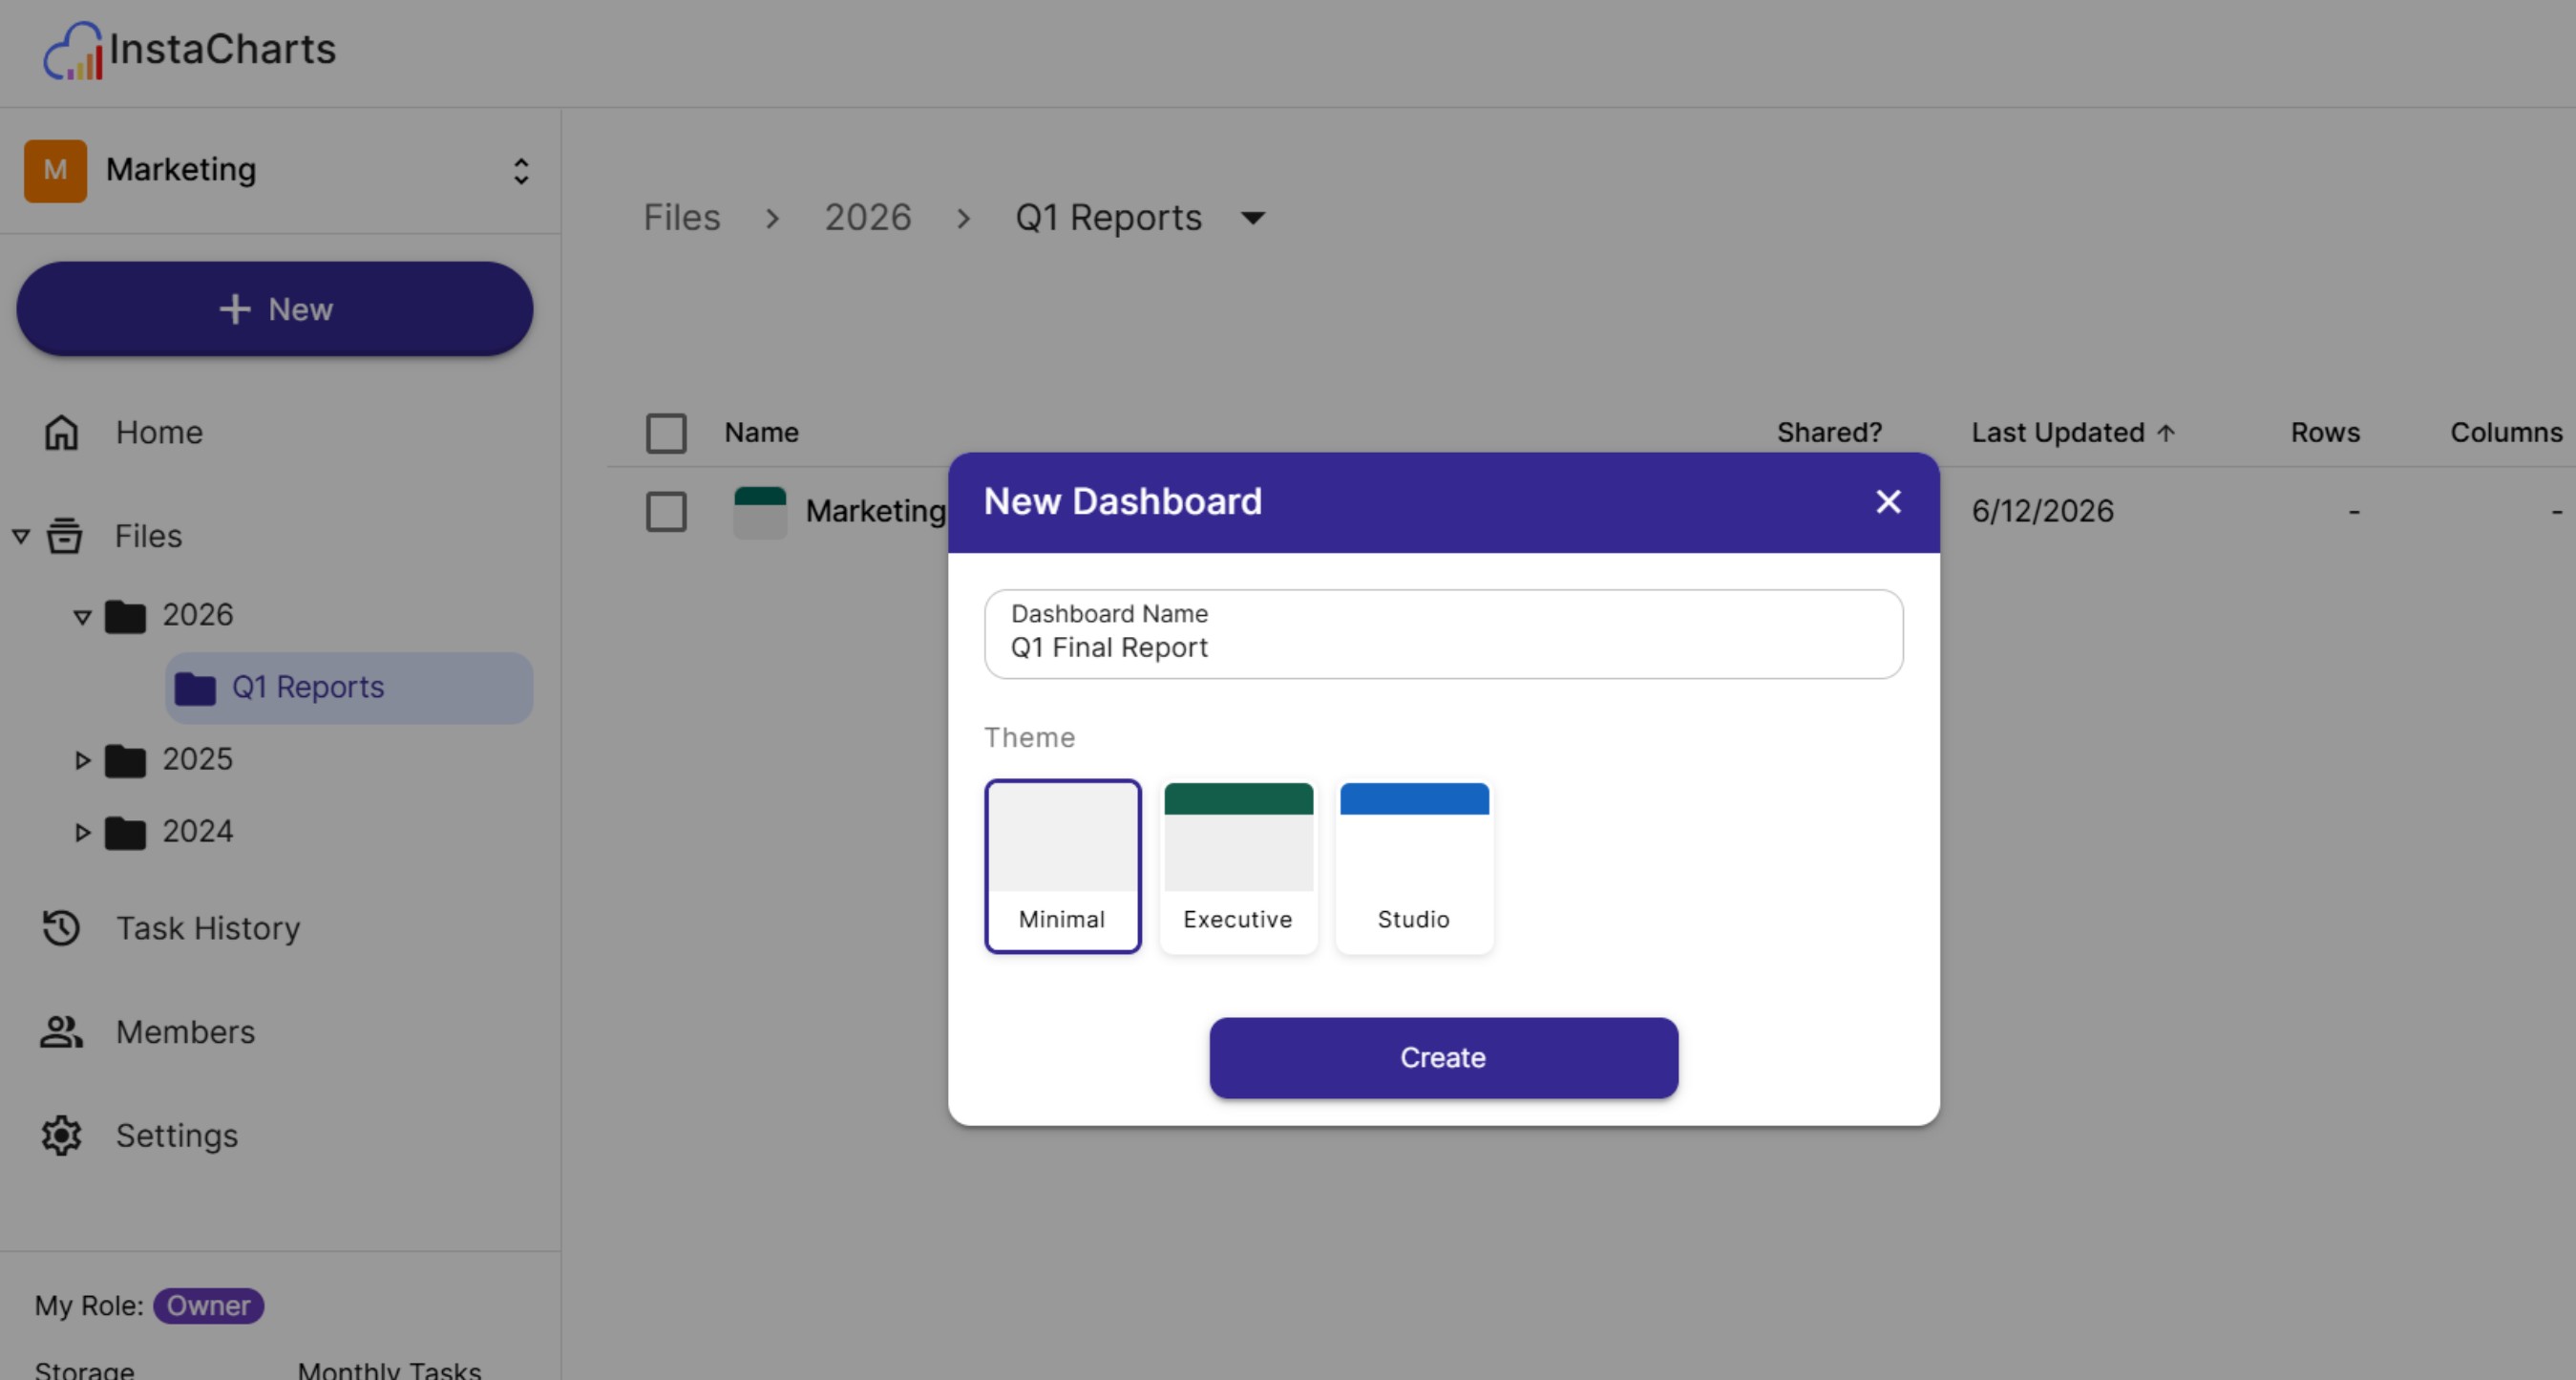
From your workspace, click New, then New Dashboard. Enter a dashboard name, pick a theme (Minimal, Executive, Studio, Midnight, Broadsheet, Neon, Ember, Financial, Pastel or Code) and click Create. This choice does not need to be final, since you can retheme the entire dashboard at any time (more on that below).
2. Add a sheet
Every dashboard is powered by your data. Add a sheet to the dashboard by either:
- Picking an existing sheet from your workspace, or
- Uploading a new sheet from a spreadsheet file
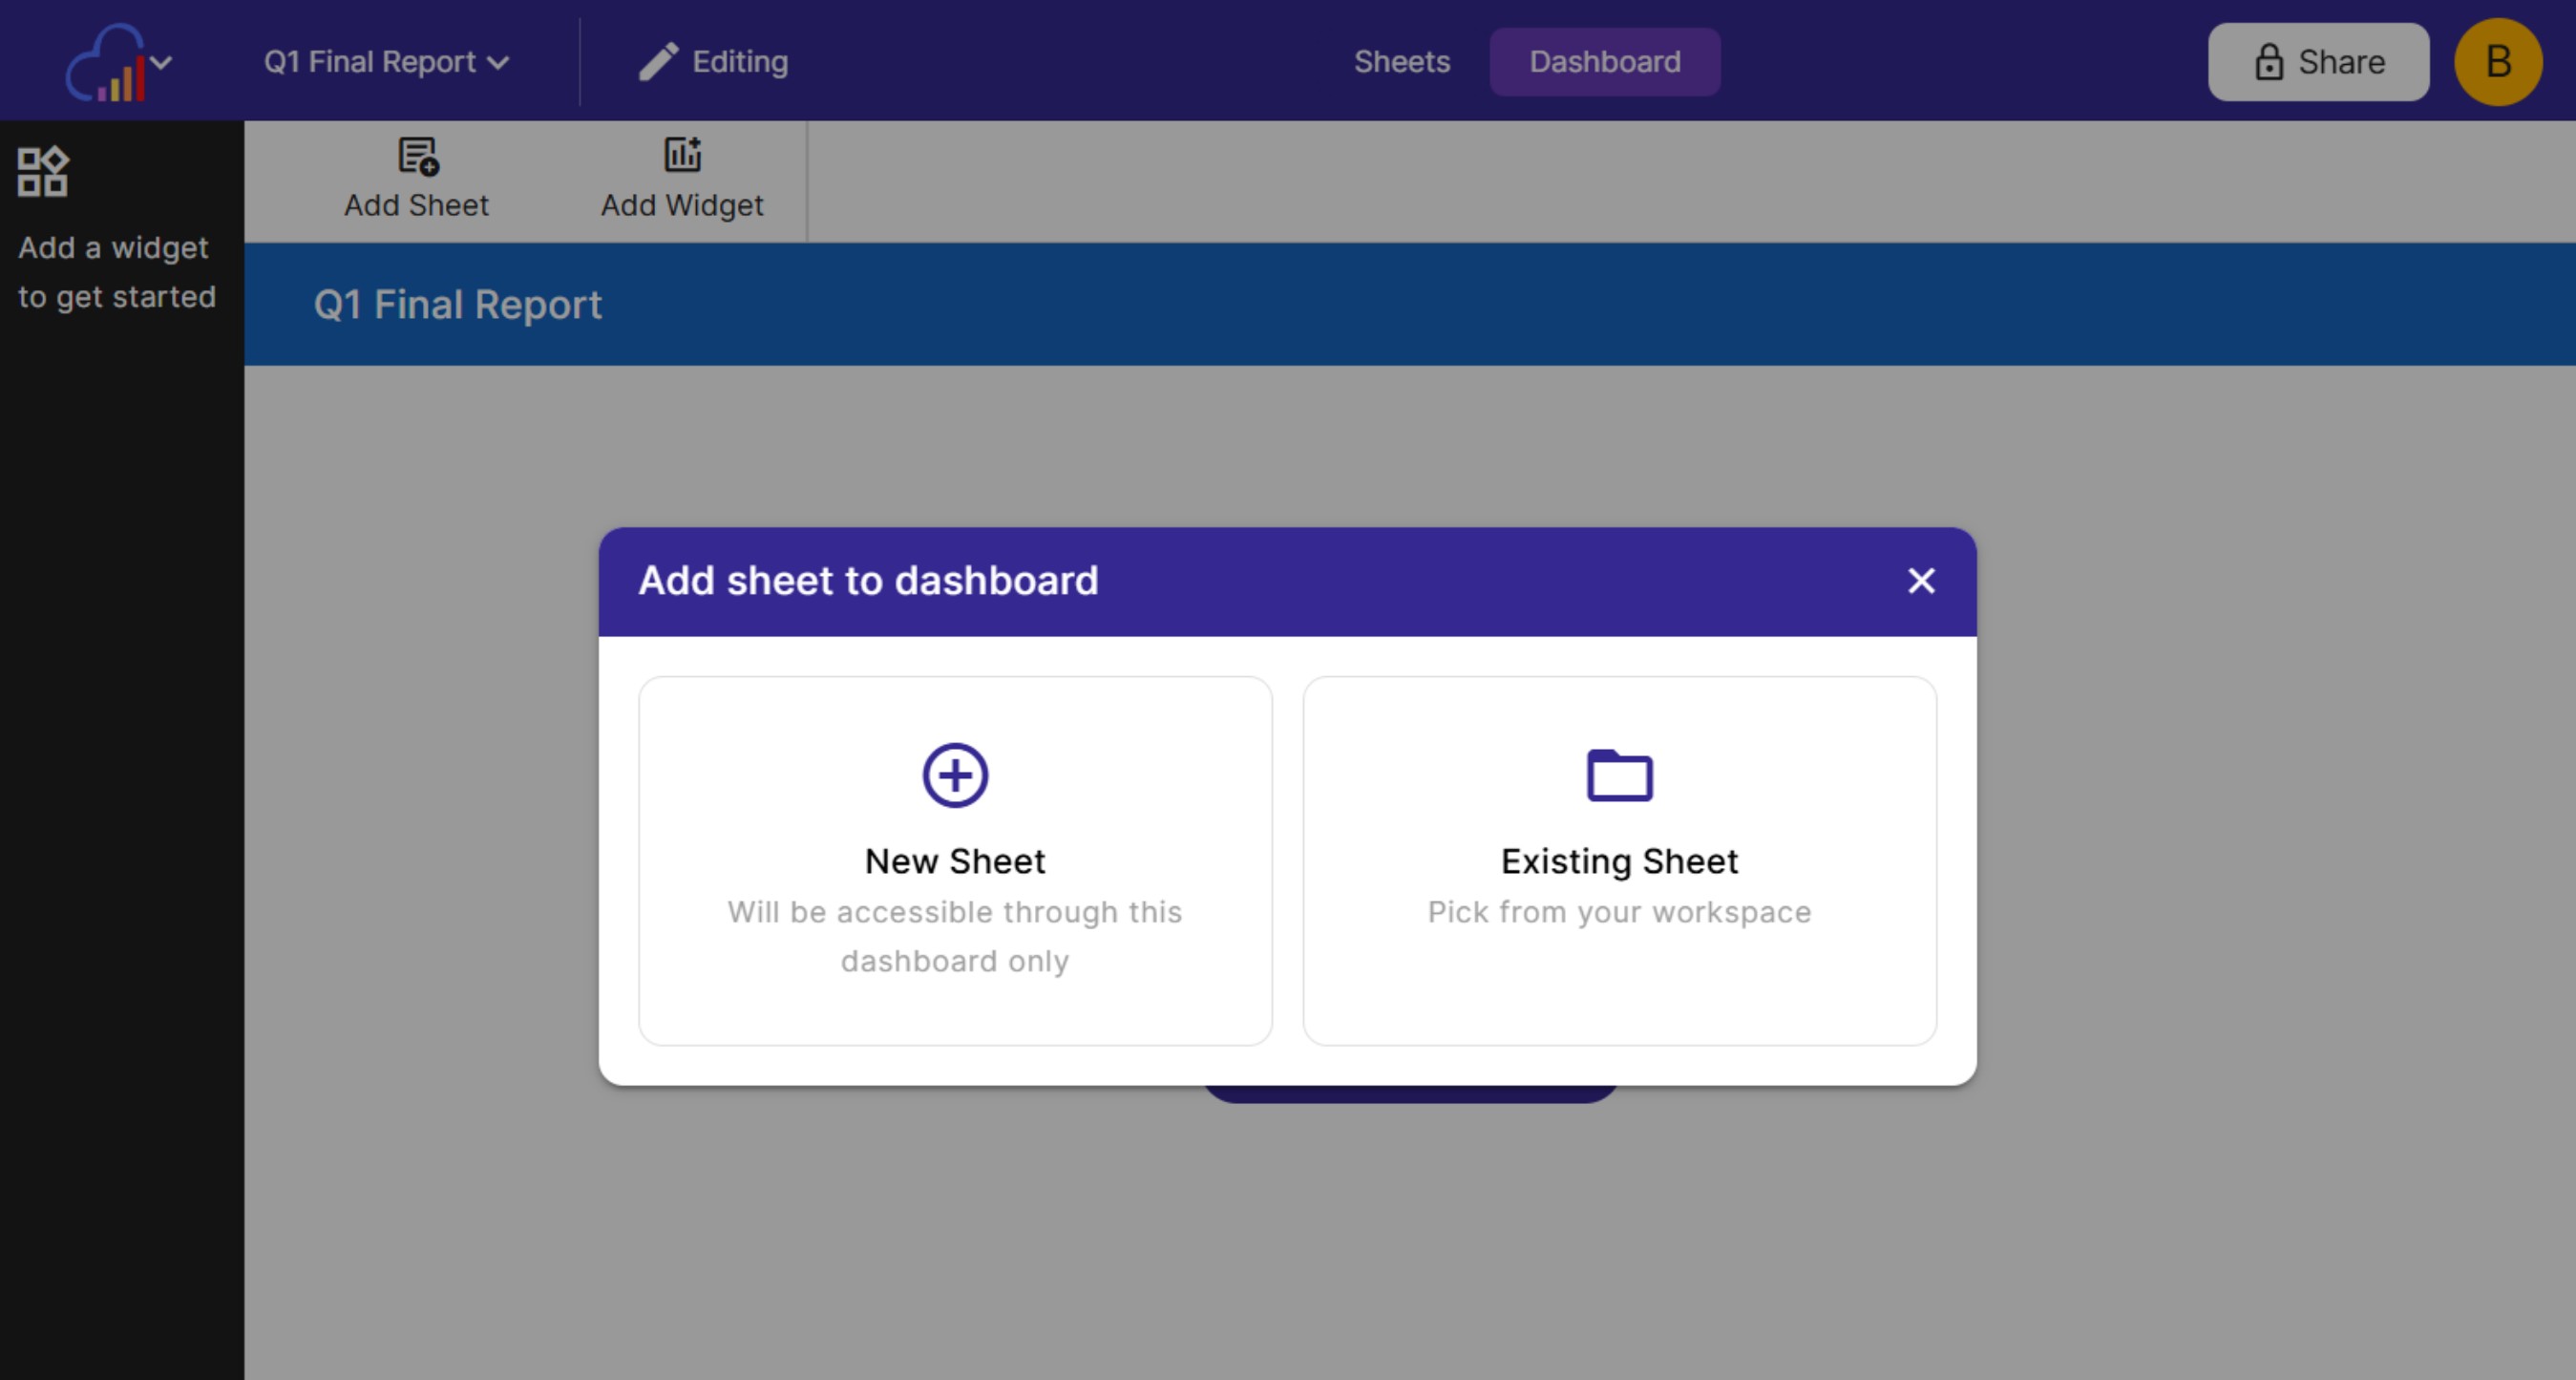
InstaCharts supports many file types, including Excel, CSV, TSV, JSON and Google Sheets. For a full walkthrough of uploading data, see our guide on how to create a chart from a CSV file.
Want to combine data from several spreadsheets? Just keep adding sheets. A single dashboard can pull from multiple sheets, so there’s no need to merge files first.
Chart and data table widgets read from your sheets, so they show new data whenever a sheet is refreshed. Sheets that sync with Google Sheets can refresh on a schedule (a paid plan feature), and a sheet built from a file can be refreshed by updating it with a newer file.
3. Add widgets
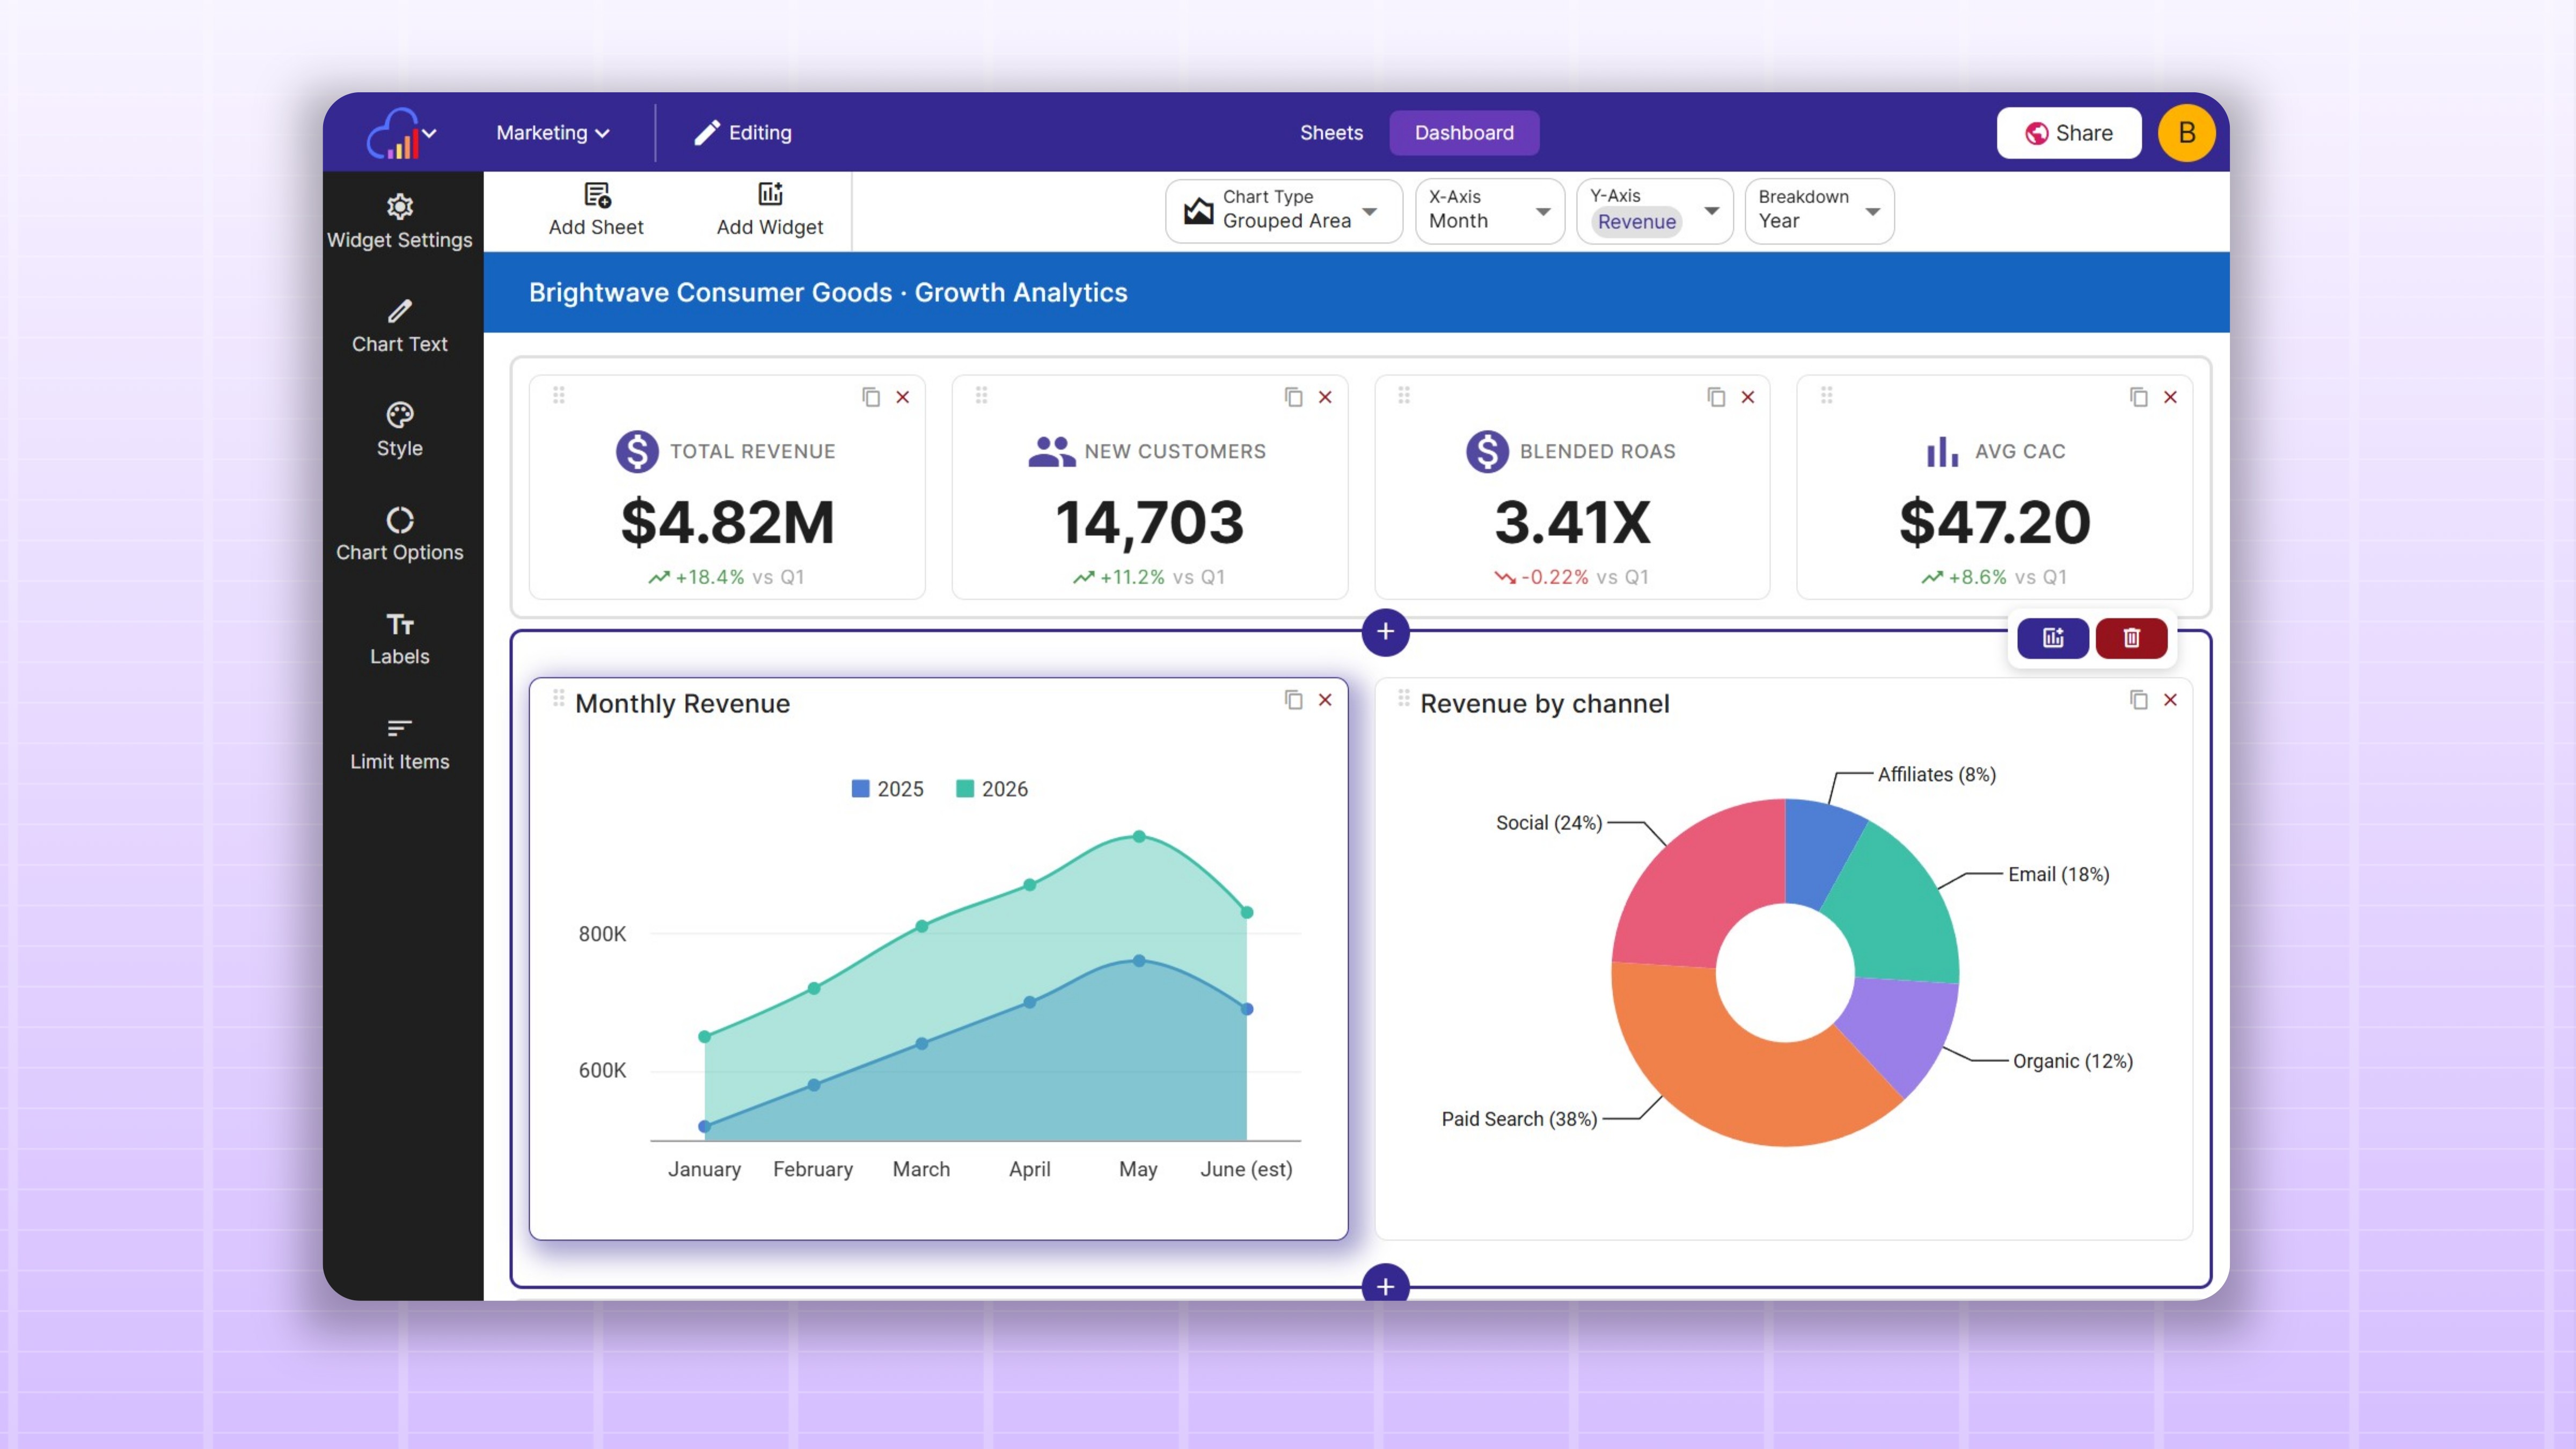
With your sheets in place, it’s time to build out the dashboard. Widgets are organized into rows, so your dashboard stays neatly laid out as it grows. Drag and drop widgets to move them between rows. There are four widget types to mix and match:
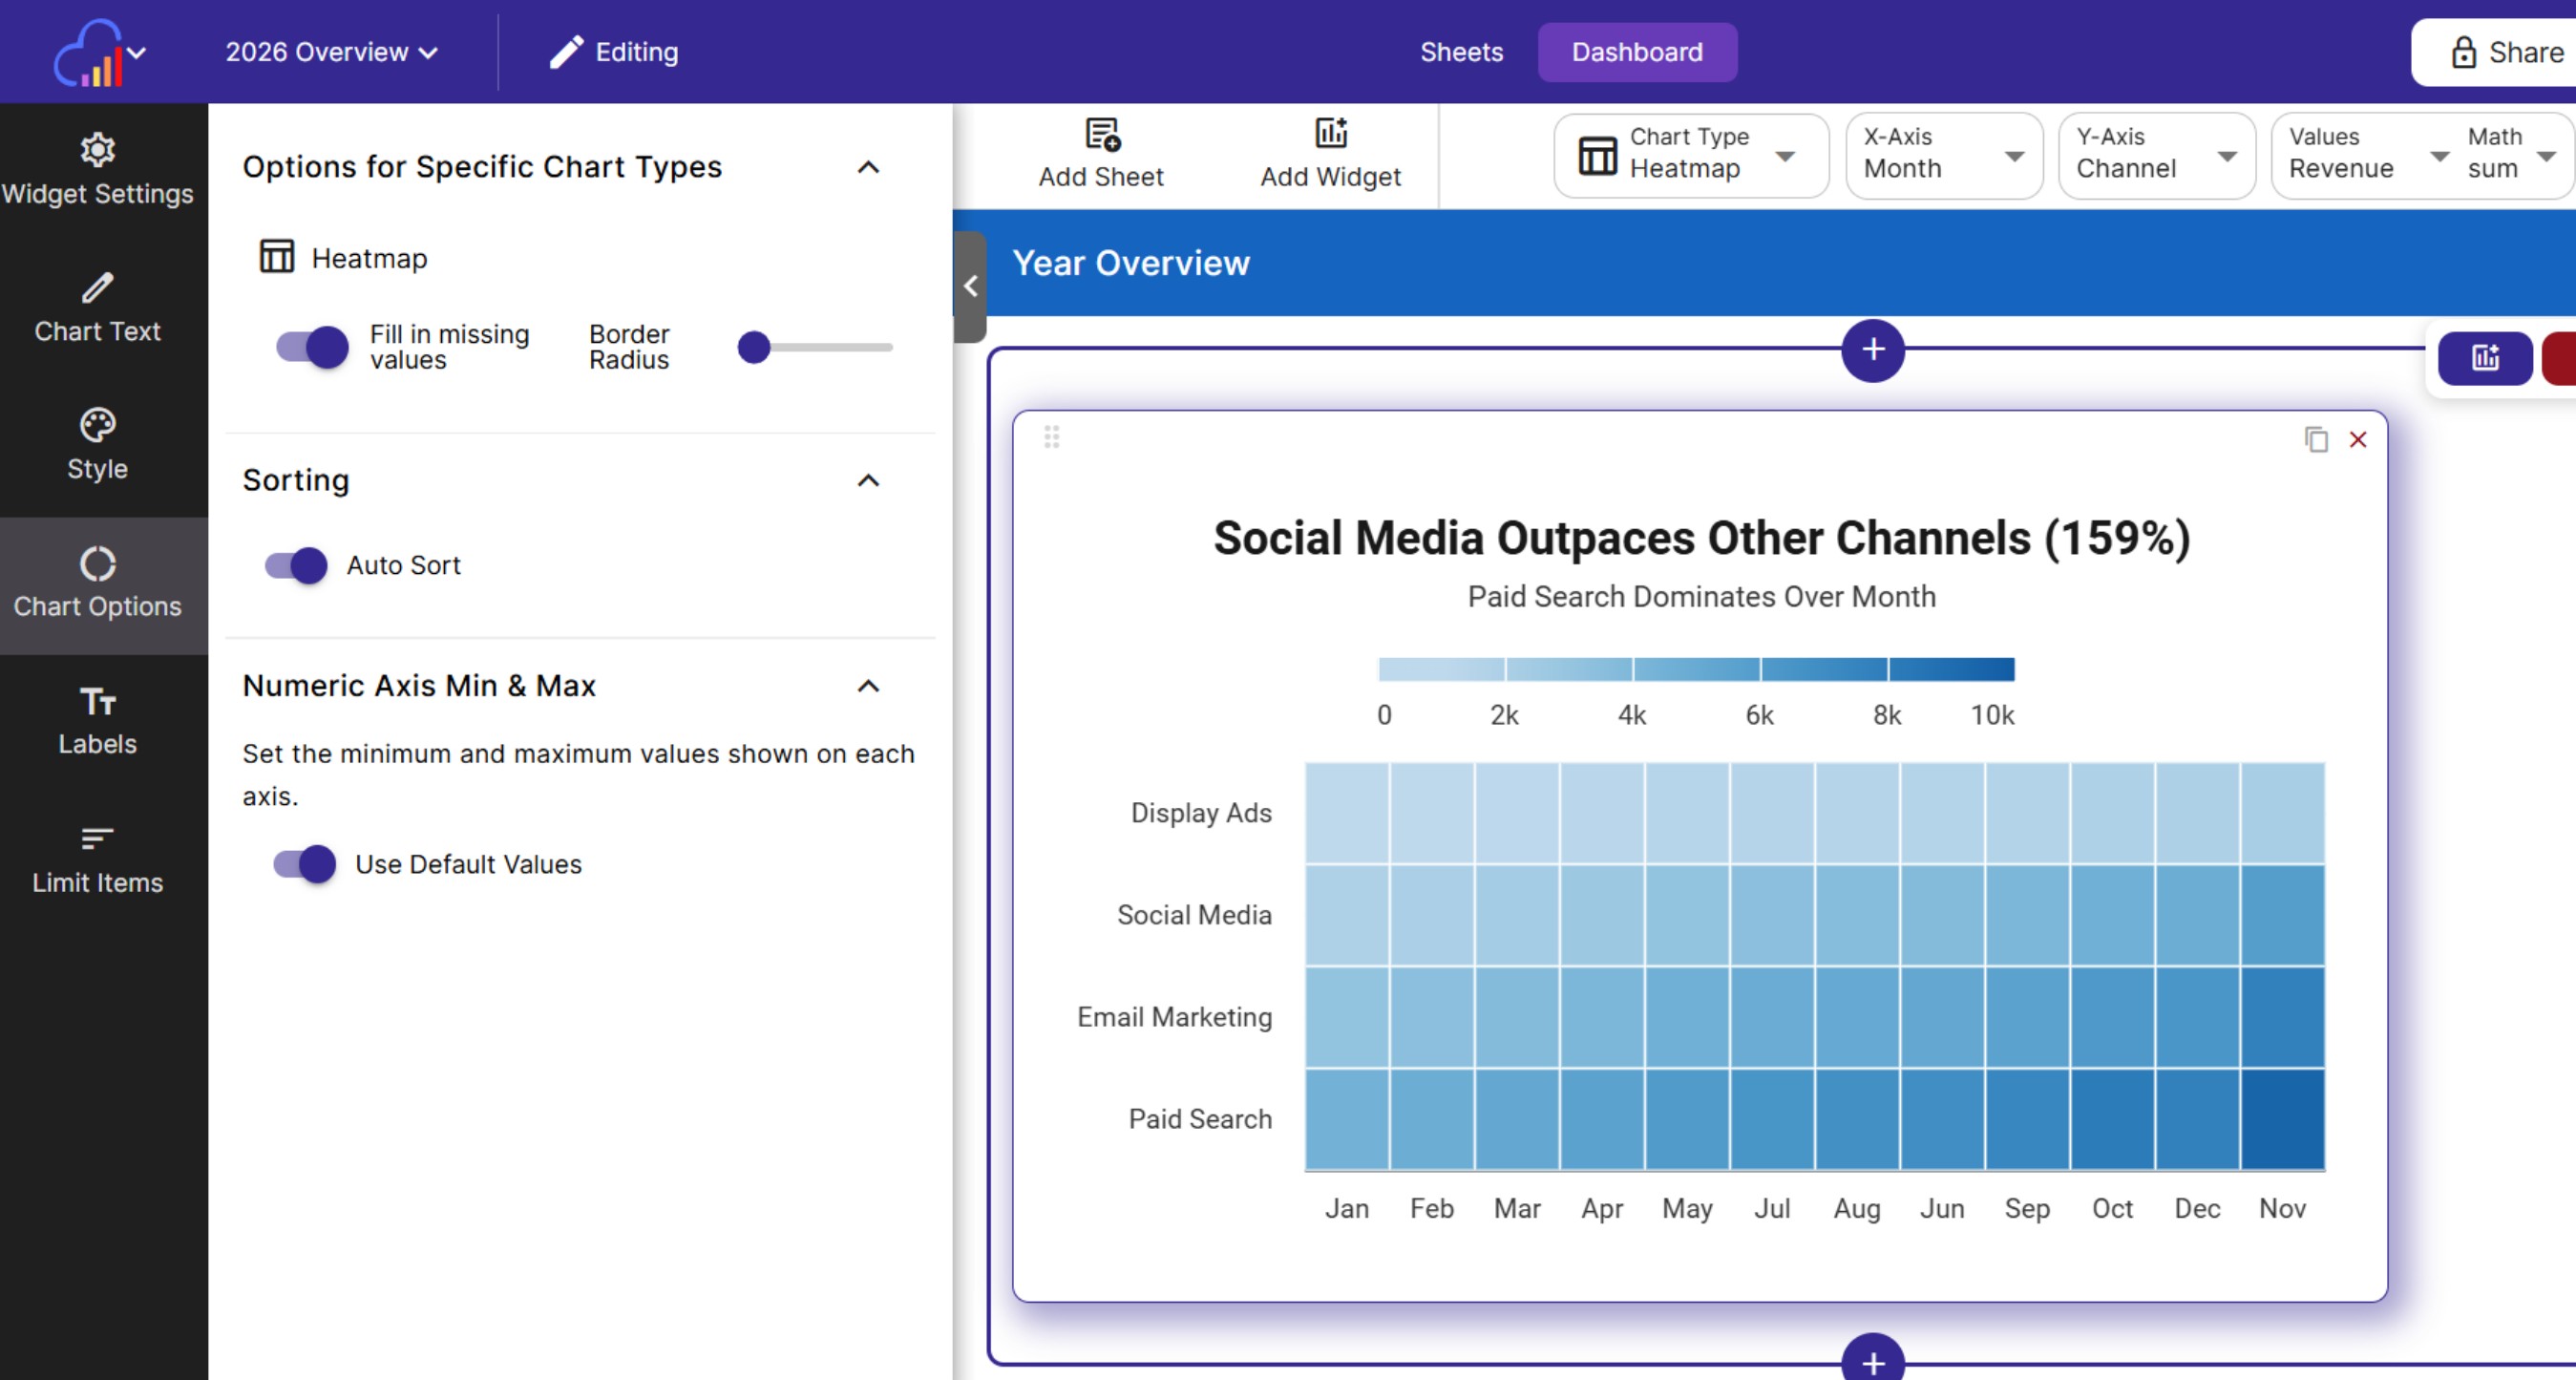
Chart widgets
Chart widgets are fully customizable, just like a regular InstaCharts chart. Pick the chart type, choose the columns to plot, and adjust the titles, labels and colors until it tells the story you want.
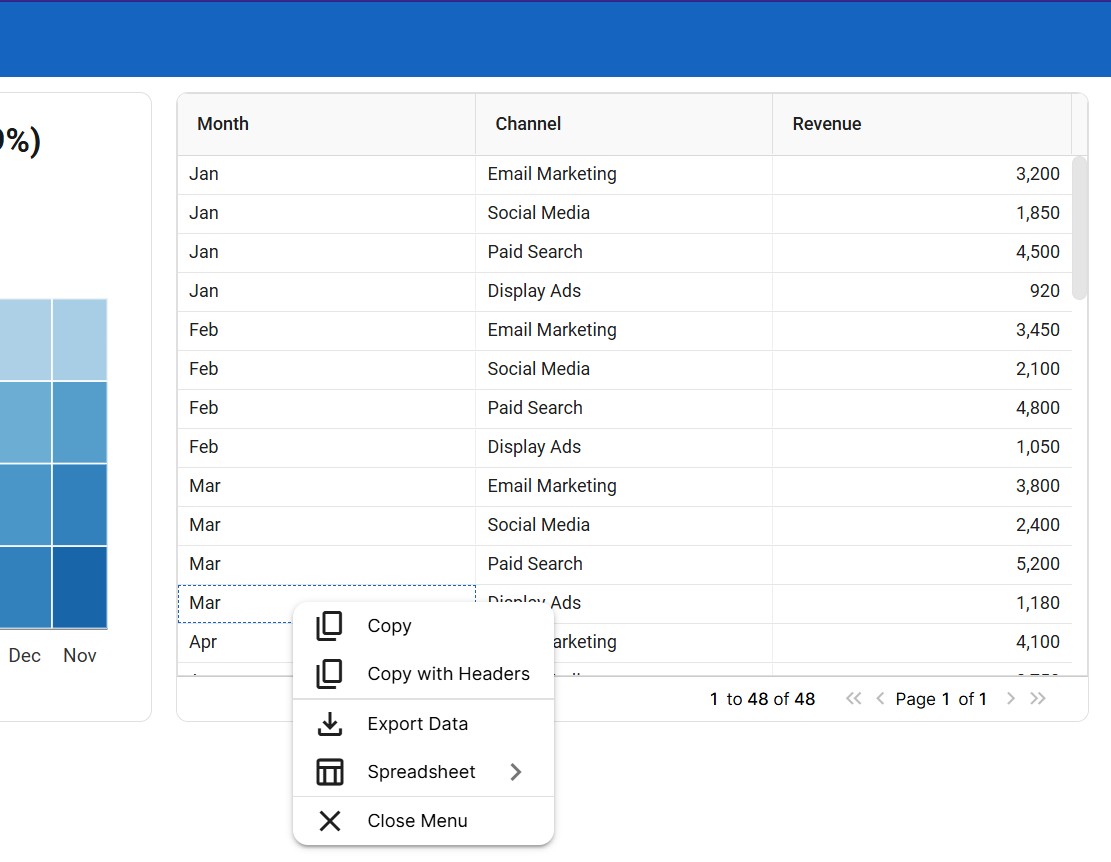
Data table widgets
Add a sortable data table of your sheet data right alongside your charts. You can choose to include only certain columns, so viewers see only the data that matters.
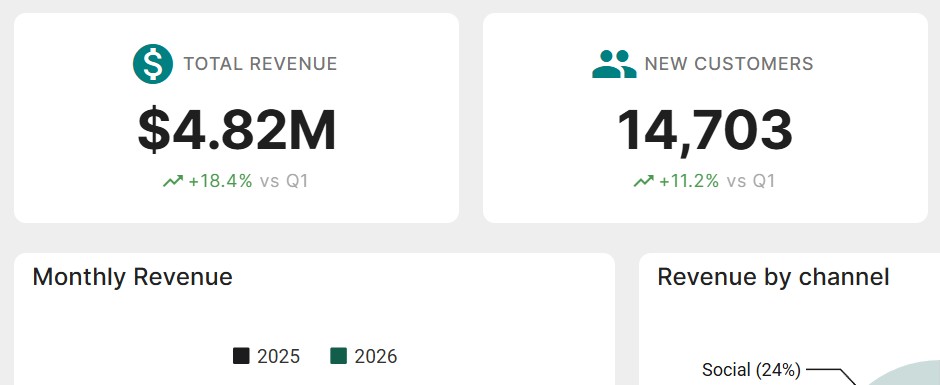
KPI widgets
Show your KPIs with dedicated KPI widgets. Enter the value, label and an optional trend percentage for each one, and they render as big, readable numbers for an at-a-glance summary row.
Text widgets
Numbers are easier to understand with context, and the text widget lets you add it directly on the dashboard through titles, explanations and takeaways.
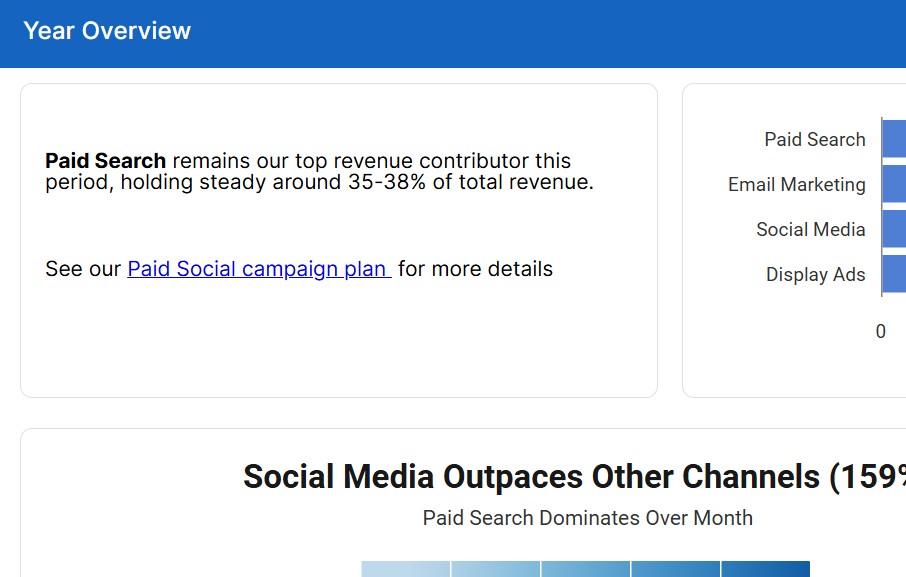
Dashboards are also responsive and automatically resize for mobile.
Build widgets with AI
Every dashboard has an AI prompt bar in the toolbar. Describe what you want in plain language and press enter. The AI can add widgets (“add a table of orders” or “add a KPI for total revenue”), add filters (“add a region filter”), edit existing widgets (“change that chart to a bar chart”), or design a full dashboard from a sheet with “design a dashboard for me”. Each request uses 1 AI credit, and the prompt bar shows how many credits your workspace has left for the month.
4. Add slicers and pages
Slicers are filters that live on the dashboard page instead of on a single chart. Click Add Slicer in edit mode, pick a column, and any viewer of the dashboard can use it to filter every chart and data table on the page that reads from that column’s sheet. Pick lists appear for text columns with fewer than 100 distinct values, and number and date columns get typed filters such as Between or After.
For a large dashboard, open Dashboard Settings, go to the Pages tab, and turn on Enable pages. A navigation sidebar appears so viewers can jump between pages, such as a Sales page and a Marketing page, inside the same dashboard. A dashboard can have up to 20 pages.
5. Retheme your dashboard
You can retheme your dashboard at any time:
- Select Dashboard Settings, then Appearance.
- Choose a main theme.
- Check the checkbox Update widgets with new theme.
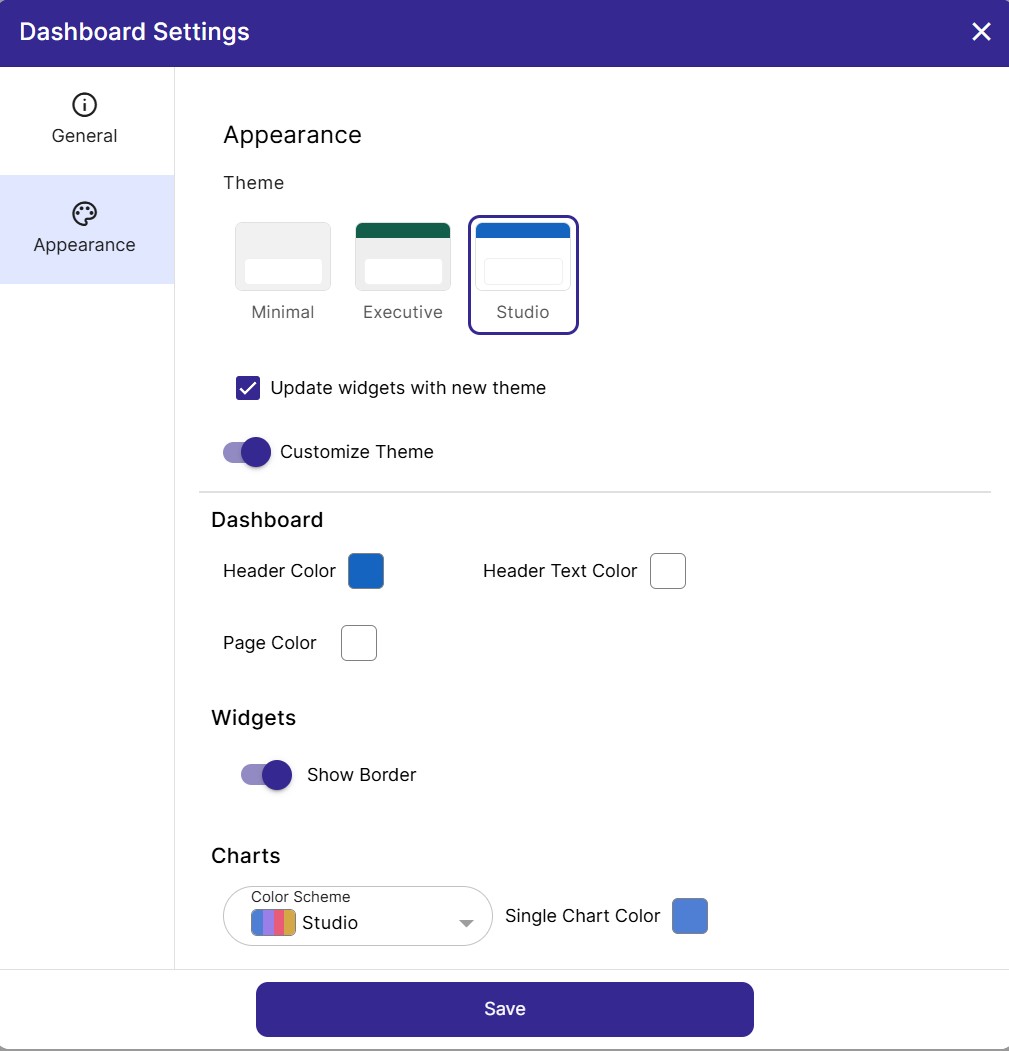
All widgets update with the new theme in one step, including chart color schemes and colors, so the whole dashboard matches.
Want finer control? Toggle on Customize theme to go further: pick a header color, background color, default chart color scheme and more. Paid plans can also add their own logo to the dashboard header.
6. Share your dashboard
When your dashboard is ready, share it! Dashboards are shared with your workspace members by default, so your team sees the latest numbers automatically. Click Share on the dashboard toolbar to choose who can view it: only your workspace, specific users, or anyone with the link. Sharing publicly or with specific users requires a paid account, and free accounts keep dashboards private to their workspace.
A shared dashboard also has an embed option, so you can place the live dashboard in your own website. Paid plans include share analytics that show how many people have viewed the dashboard.
Because chart and data table widgets stay connected to your sheets, everyone sees current data instead of emailed screenshots that go stale.
Give it a try
Building a dashboard from a spreadsheet takes a few steps and requires no code, design skills or data team. Sign up for a free account and build your first dashboard today!