
Data Exploration
A data visualization tool built to be powerful and easy to use
Explore, clean and transform the data in your spreadsheets. InstaCharts suggests the most effective visualizations to highlight key trends, and lets you combine your spreadsheets into one dashboard.
Analyze
Analyze Your Data Visually
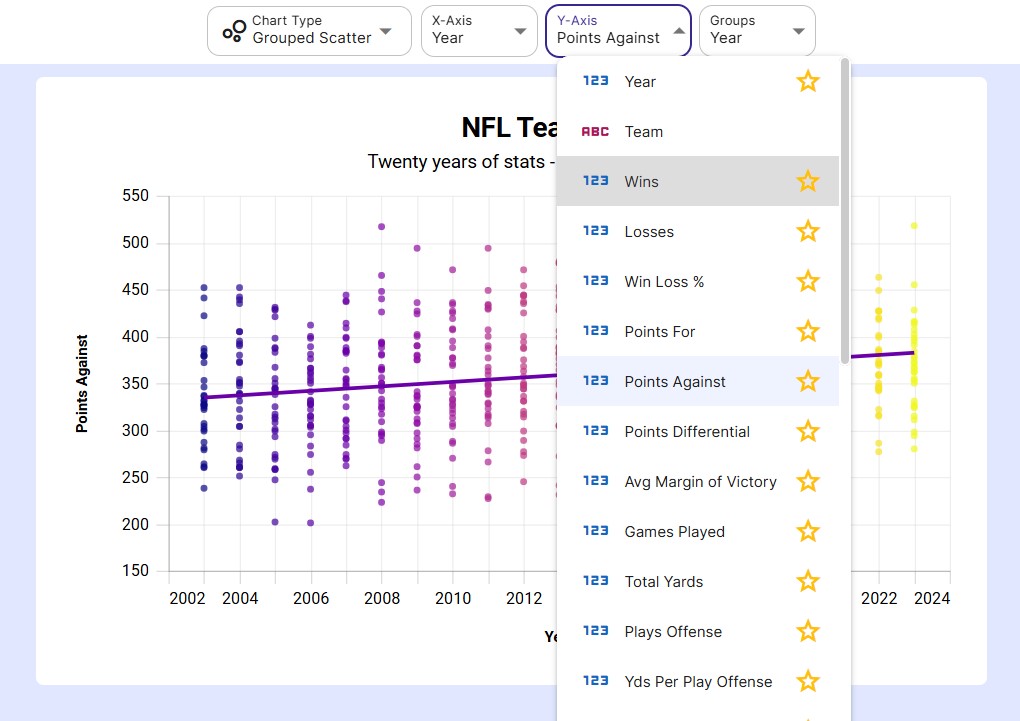
InstaCharts automatically analyzes your data and suggests the most effective visualizations to highlight key trends
Visualize
Turn Your Data Into Visualizations
Upload your data and InstaCharts builds a chart from it automatically. Create clear visualizations in seconds:
- Interactive Trend Analysis
- Pattern Recognition
- Comparative Analysis
- Distribution Analysis
- Top & Bottom Rankings
- Correlation & Trend Lines
- Data Summaries
- Part to Whole Breakdowns
Explore
Find the story in your spreadsheet
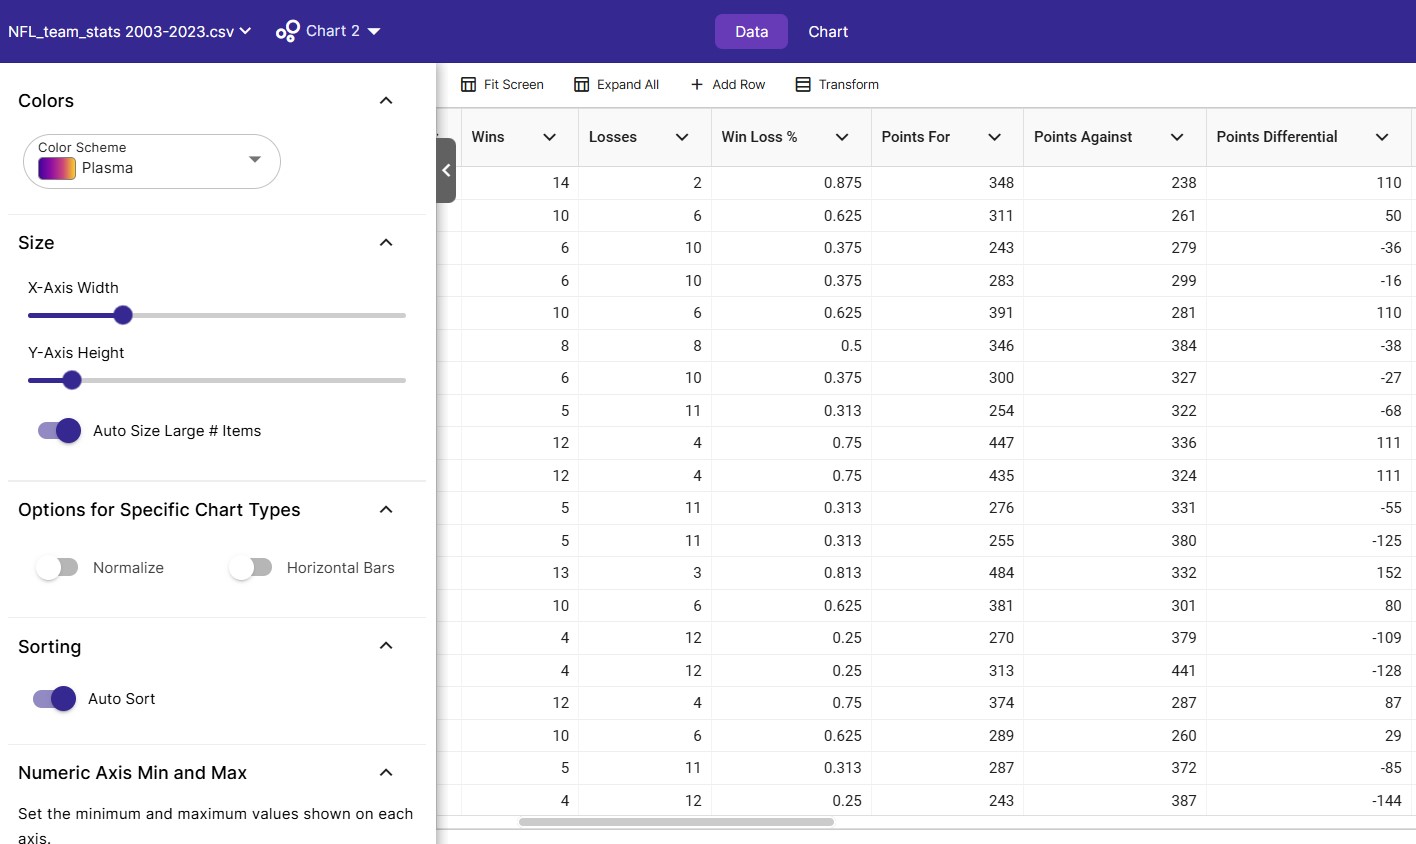
Sort, filter and summarize your rows to find trends, outliers and the categories that lead the rest.
Sort, Search & Filter
Sort any column, search every column with the quick filter, and filter by text, numbers and dates.
Summarize Your Rows
Chart the sum, count, average, median, minimum, maximum or distinct count of each category.
Smart Column Types
InstaCharts detects numbers, currencies, dates and text in each column, and you can change any type.
Transform
Reshape and clean your data
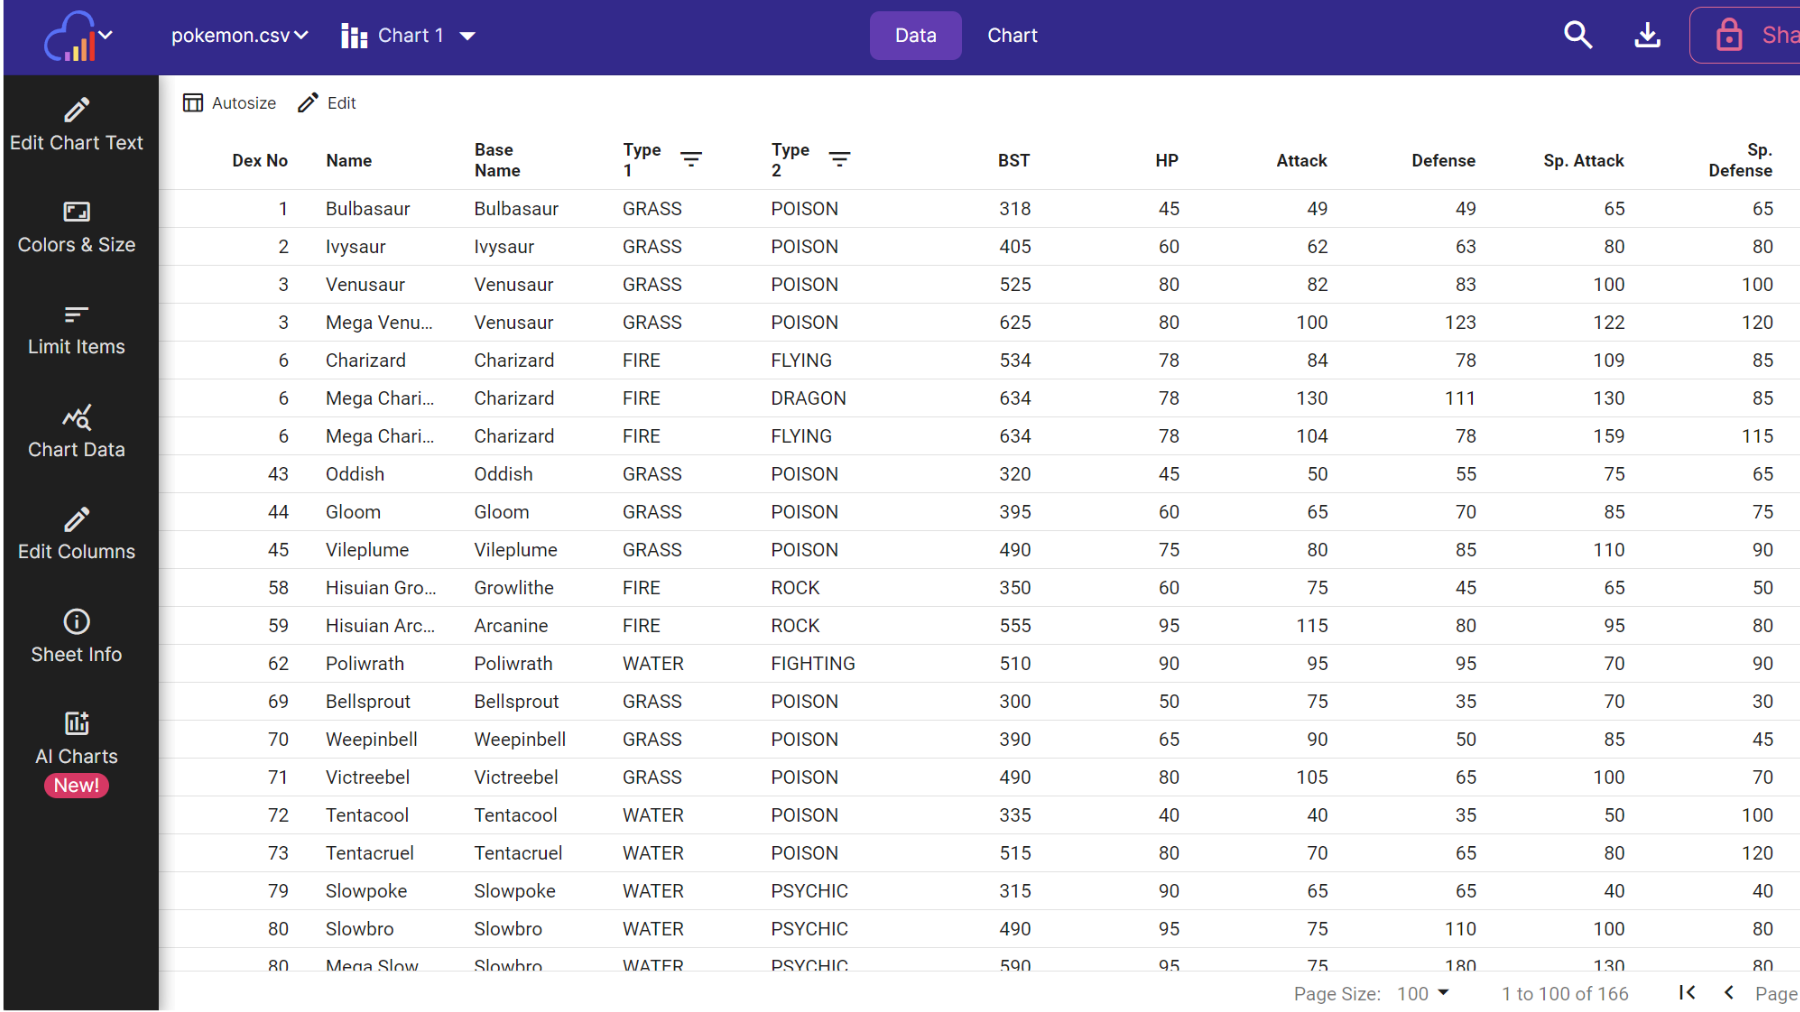
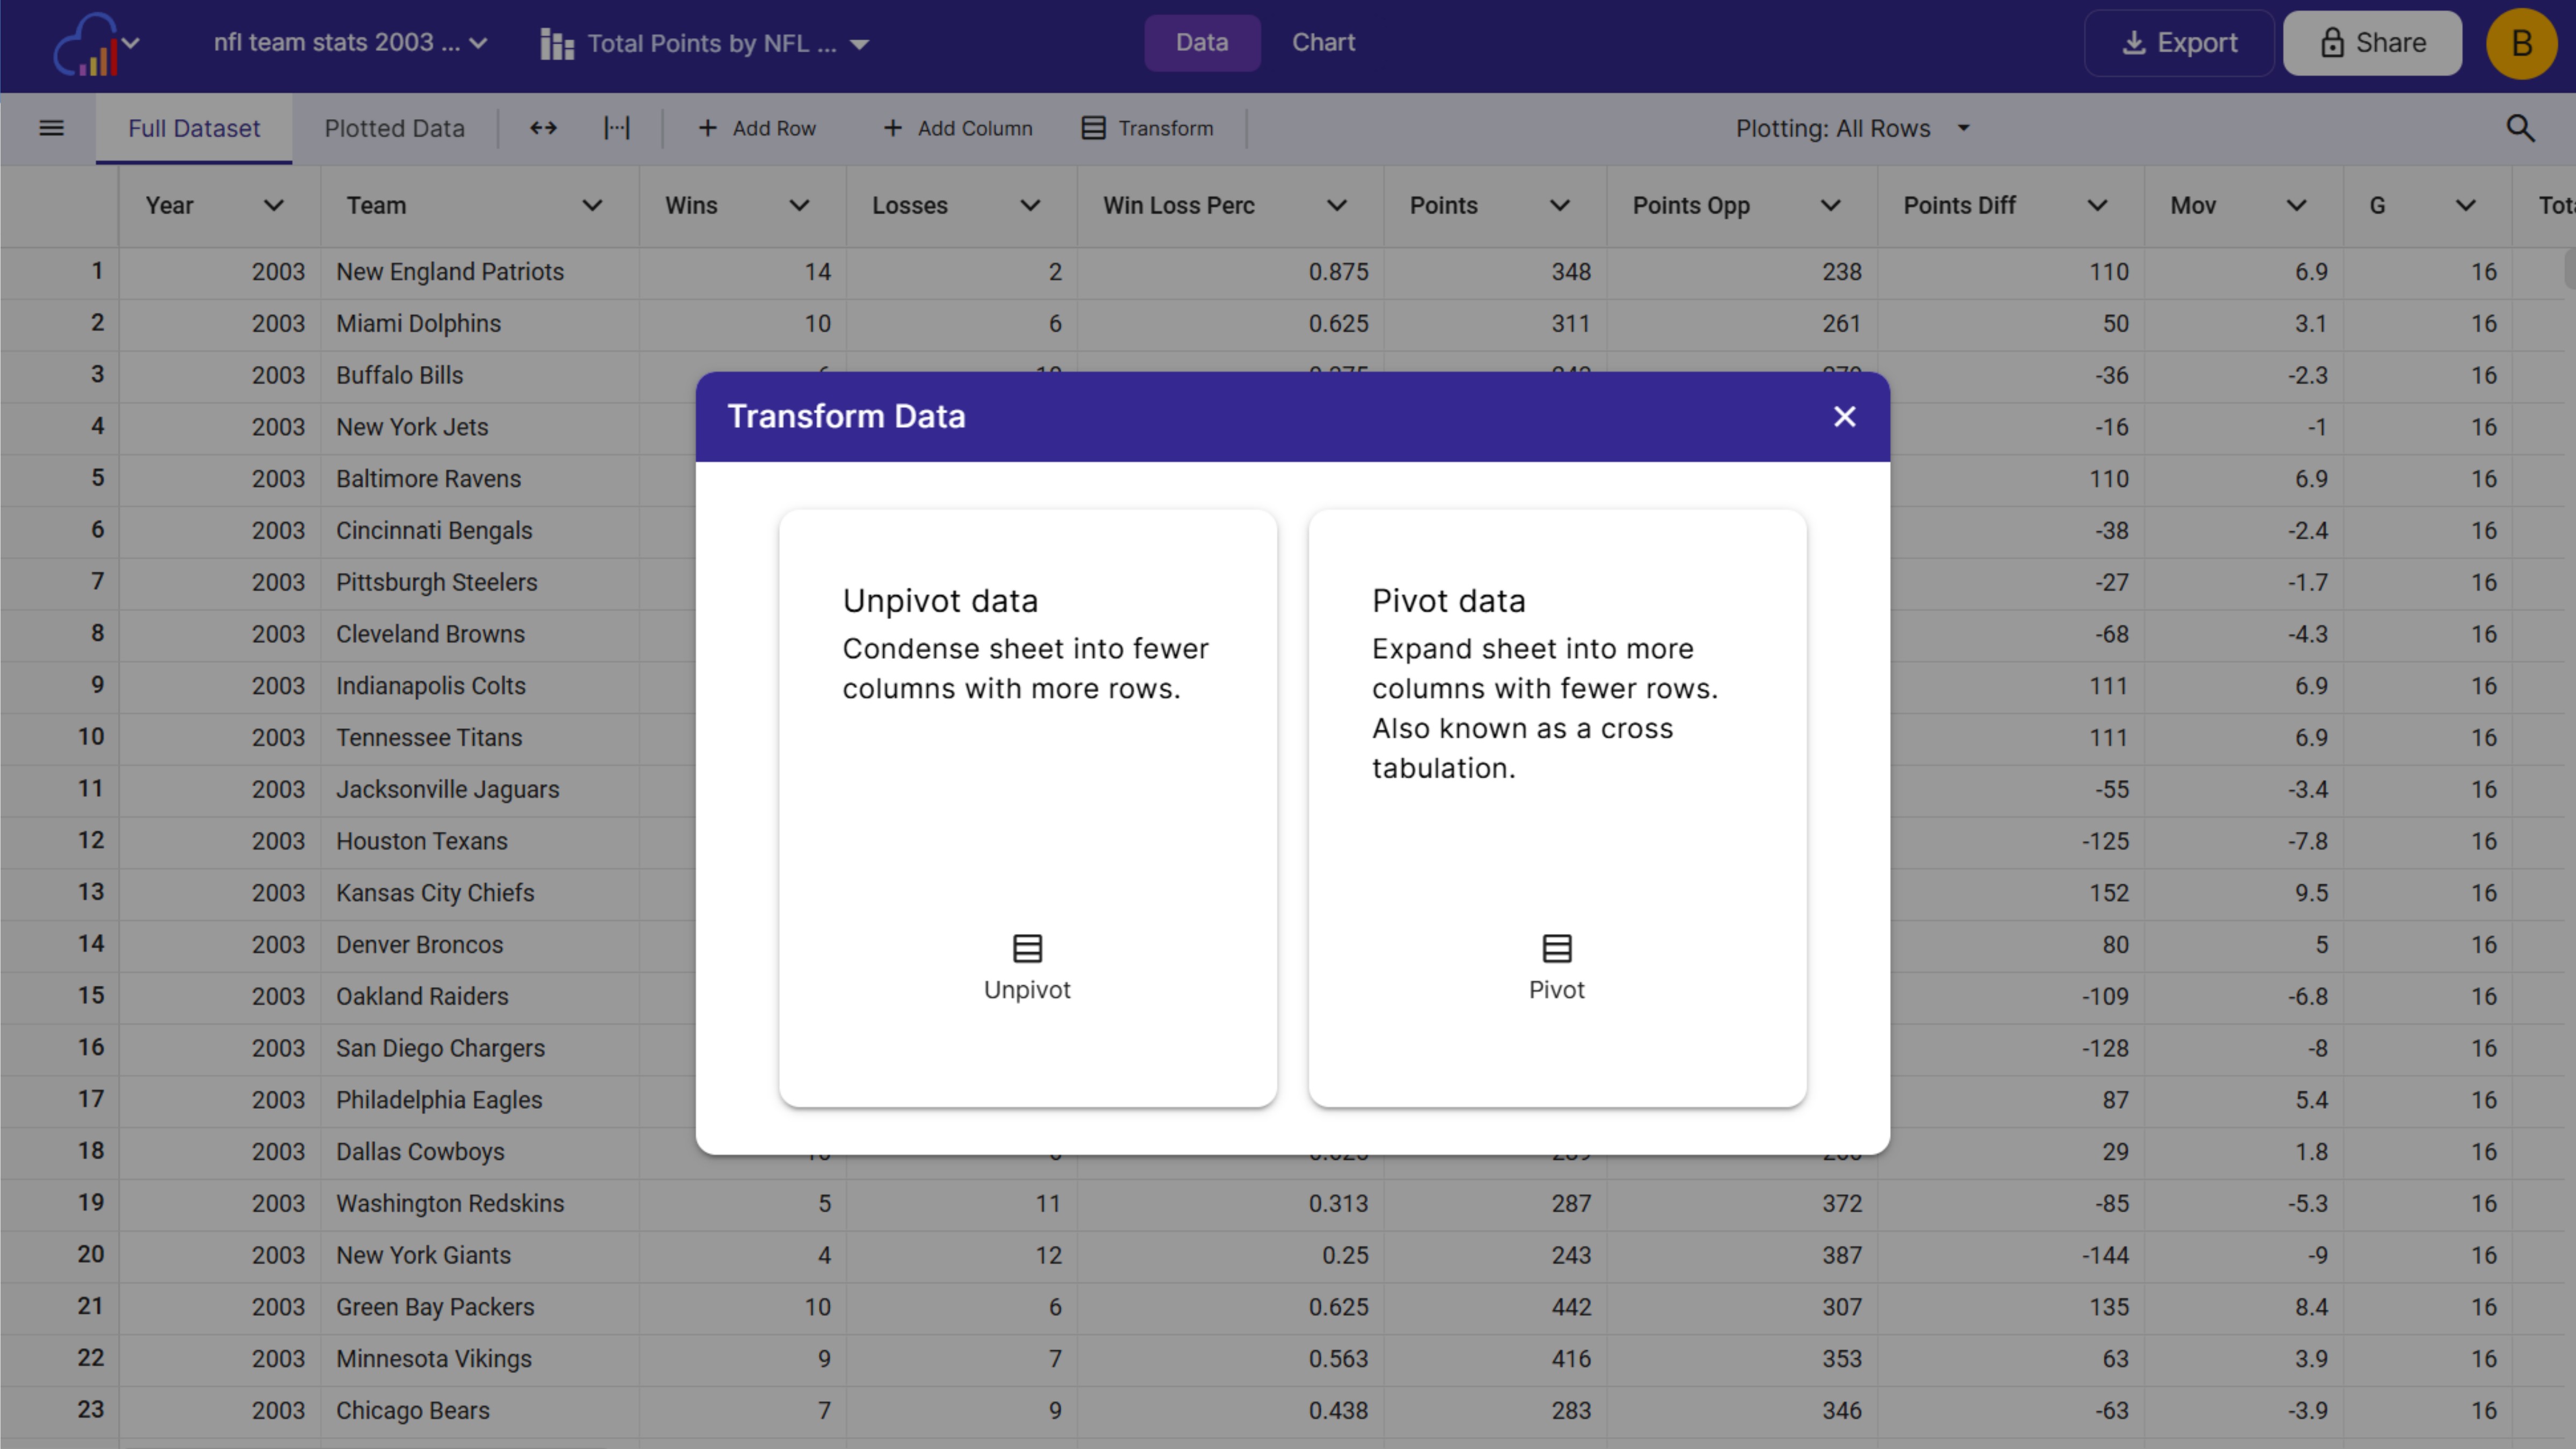
Get your data into the right shape for analysis with built-in transforms, right inside the data table.
Pivot & Unpivot
Expand a sheet into a cross tabulation, or condense many columns into fewer columns with more rows.
Split & Merge Columns
Split one column into several with a delimiter, merge columns into one, or expand JSON columns.
Edit & Clean
Edit cells, add rows and columns, and use find and replace across a column or the whole sheet.
Combine
Combine your spreadsheets
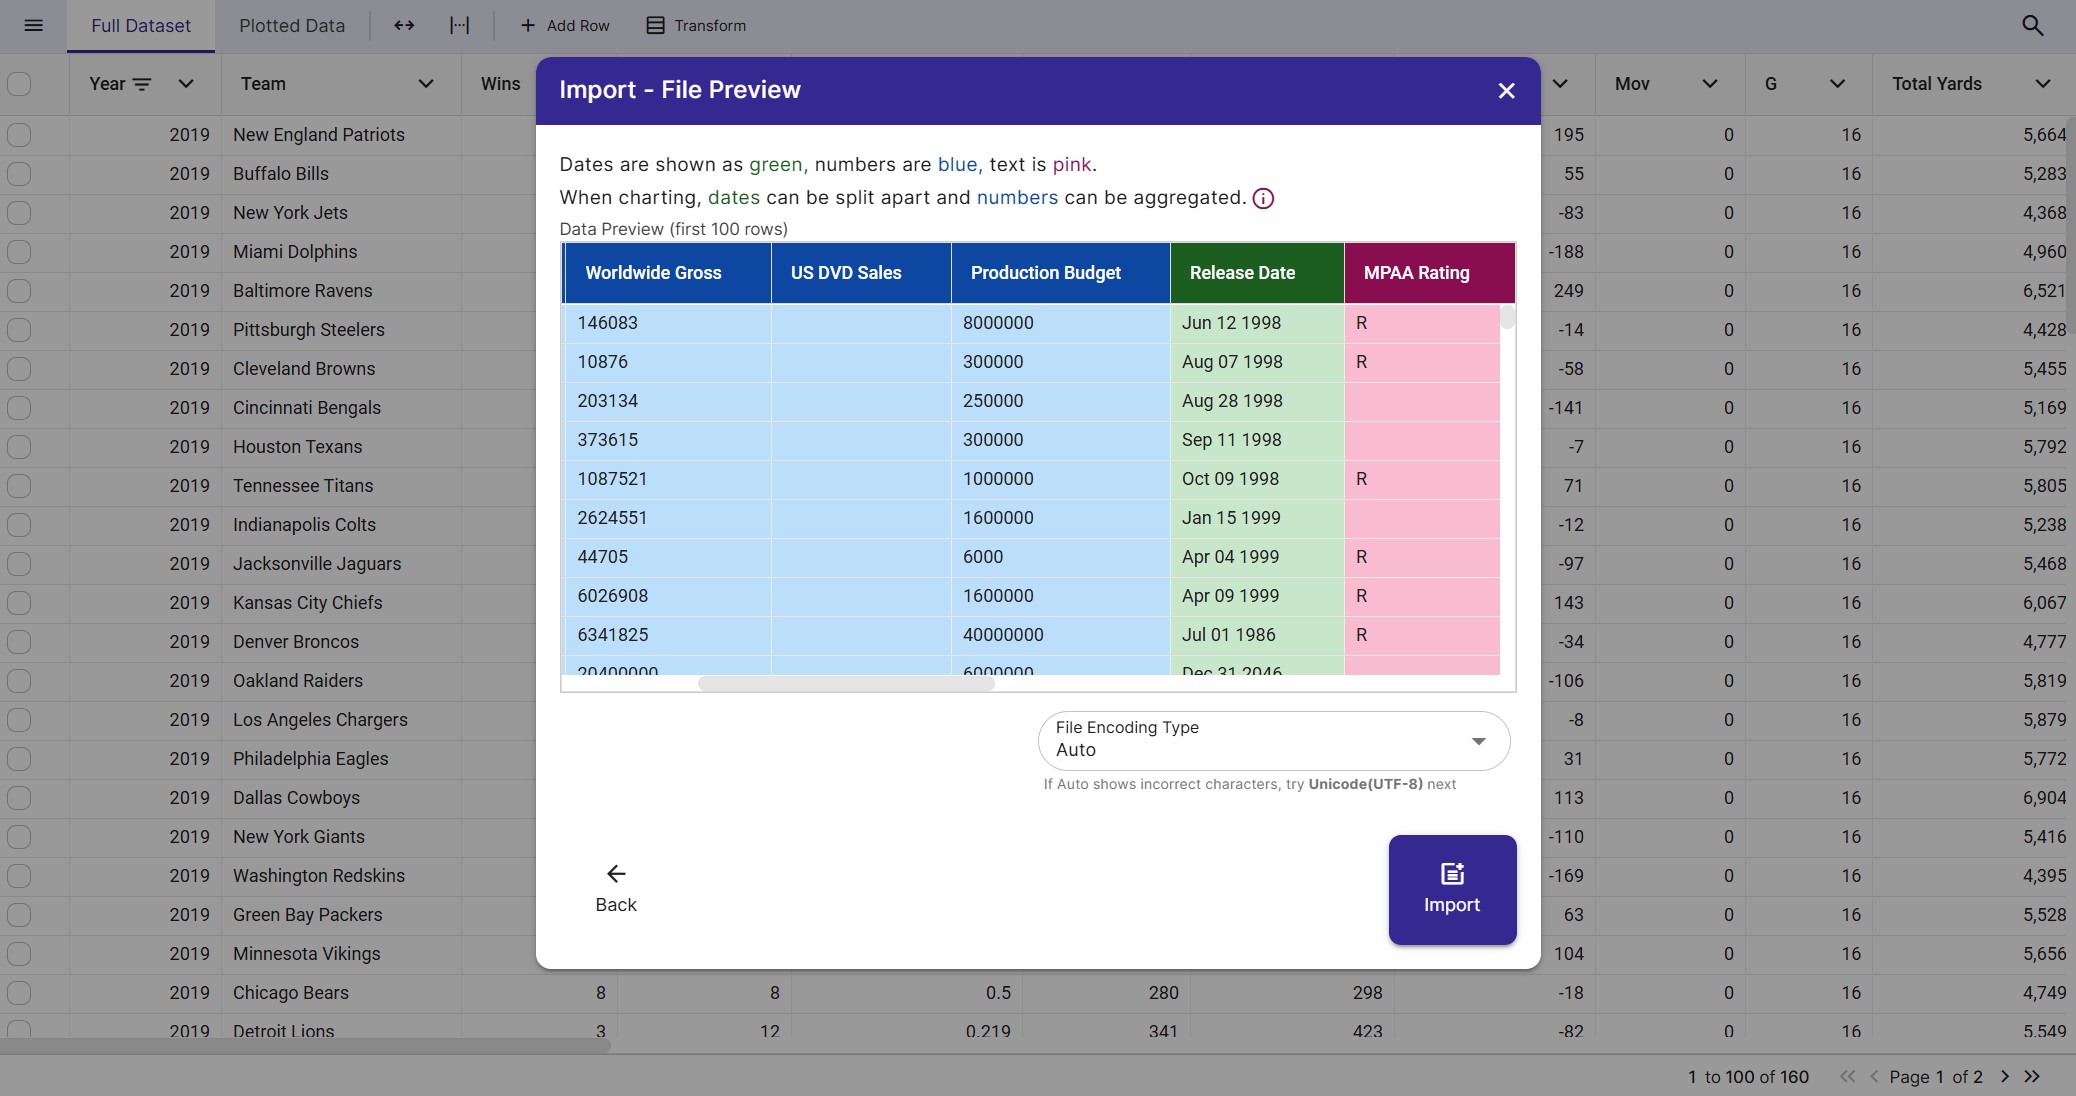
Bring data from several files together in one sheet, with a preview of the result before anything changes.
Append Rows
Add the rows from another file to the end of your sheet, ideal for monthly exports and growing logs.
Add Columns
Place the columns from another file next to your current columns, with the rows lined up in order.
Column Matching & Preview
Columns are matched by name, then by position, and a preview shows the result before the update runs.
Features
Features for Exploring Your Data
Smart Visualization Suggestions
Recommended Charts look at your column types and set up the charts that fit your data best.
AI Insights
Generate 3 AI charts with titles and captions, plus a data summary that calls out outliers and data quality issues.
Real-Time Exploration
Charts update as you filter, sort and change your data, so you can test ideas and explore different angles in seconds.
Bin Ranges & Top Items
Group numbers into ranges to see how they are distributed, and limit a chart to the top or bottom items.
Trend Lines
Add an average or a line of best fit, with its equation, R², r and n written into the chart caption.
Export Your Results
Download your transformed data as CSV, Excel, TSV or JSON, and your charts as images, PDF or PowerPoint.
Dashboards
Turn your findings into a dashboard
Bring the charts and tables from all of your spreadsheets together on one live dashboard.
One Dashboard, Many Sheets
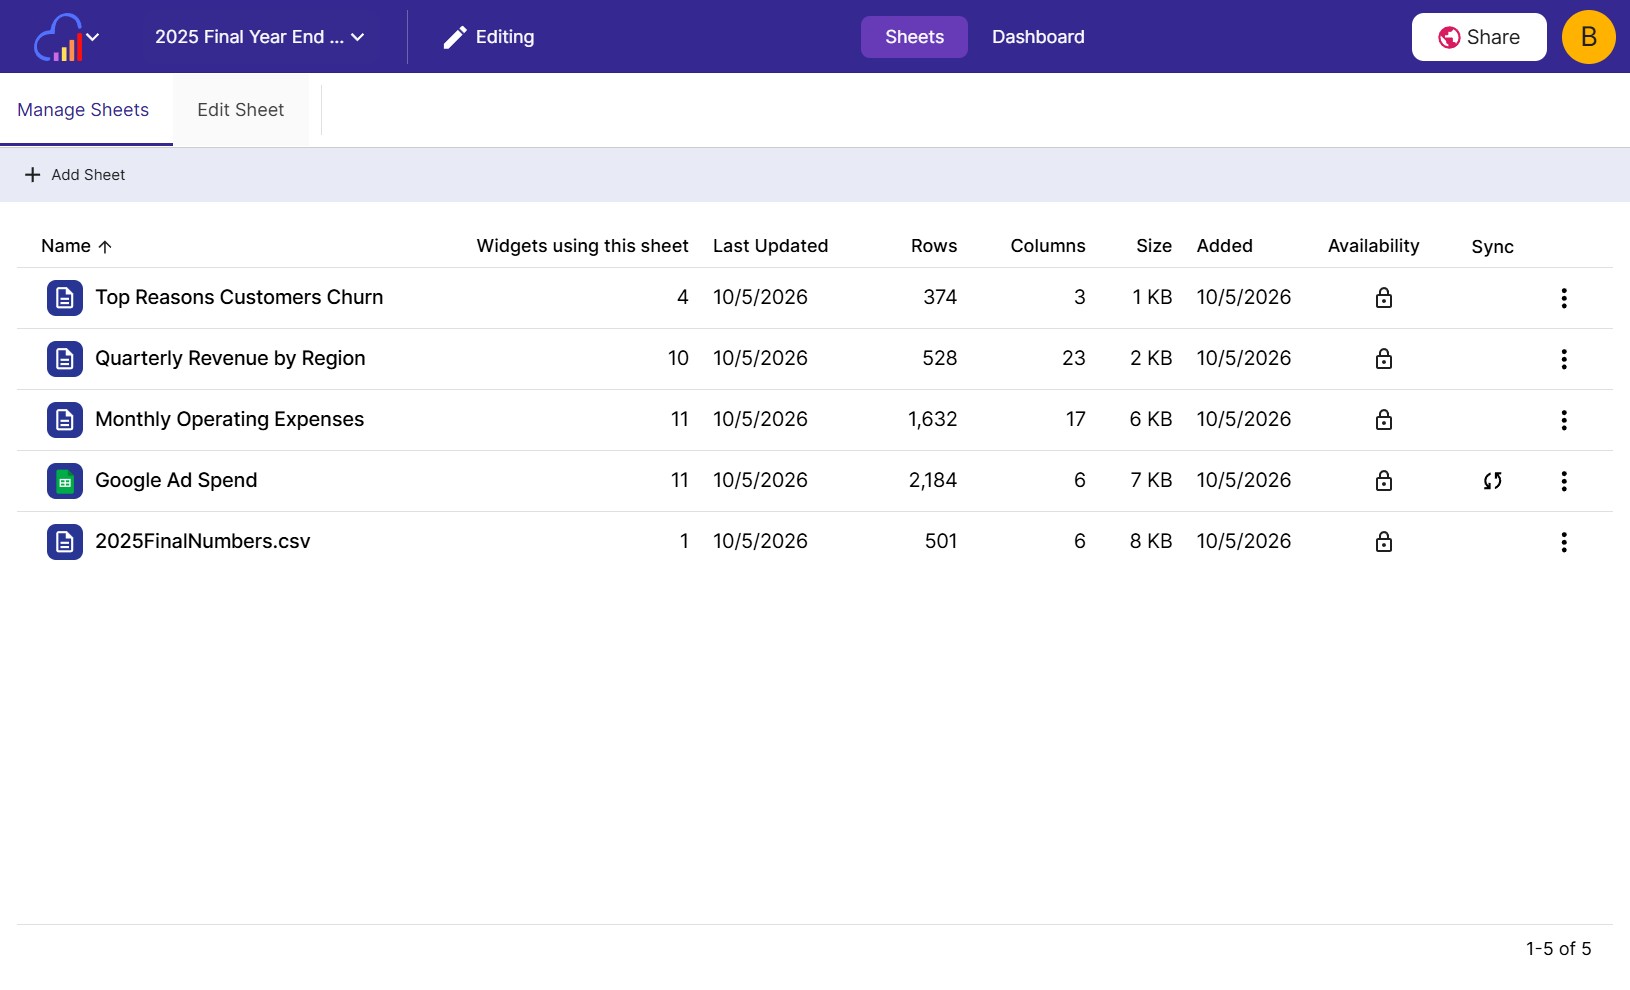
Each widget can read from its own sheet, so one dashboard can summarize several spreadsheets.
Slicers
Filter every chart and data table built from the same sheet by a value, a list or a range.
Build with AI
Describe the dashboard you want and AI adds the charts, tables and filters for you.
FAQs
Data Exploration FAQs
Data exploration is the first step of data analysis, where you look through a dataset to understand what it holds. You sort and filter the rows, summarize the numbers and chart them to find trends, outliers and patterns. InstaCharts combines an interactive data table and a chart maker in one place, so you can move between the rows and the charts as you explore.
Upload a CSV, Excel, TSV, PSV, JSON, JSON Lines or log file, or connect a Google Sheet or Google Drive file. InstaCharts shows your data in a sortable, filterable data table and recommends charts based on your columns, so you can start exploring as soon as the upload finishes.
InstaCharts detects column types automatically when you upload a file, including text, numbers, currencies, booleans, IDs, multiple choice survey answers and several date and time formats across various locales. You can change the type of any column at any time from the Edit Column window.
Click a column header in the data table to sort it, use the quick filter to search every column at once, or add column filters for text, numbers and dates. In a chart, add filters with conditions such as contains, equals, greater than, less than, between and is blank, and remove blank values and zeros.
Pick how a chart combines the rows in each category. InstaCharts can sum values, count rows, take the average, median, minimum or maximum, count distinct values, and count the rows that have or are missing a value. Use bin ranges to group numbers into ranges, and limit items to show only the top or bottom categories.
Open the Transform Data dialog from the data table. Choose Pivot to expand your sheet into more columns with fewer rows, also known as a cross tabulation, or choose Unpivot to condense many columns into fewer columns with more rows. InstaCharts shows a preview of the result before you apply it.
In the Transform Data dialog, choose Split Columns to break one column into several using a delimiter, such as splitting a full name into first and last names. Choose Merge Columns to combine two or more columns into a single column. Columns that hold JSON objects can be split into separate fields with Split Object Column.
Edit any cell, add or delete rows, and add, rename or delete columns in the data table. Use find and replace across a column or the whole sheet, paste copied text with Paste Special, and change column types when a column was read the wrong way. Every chart built on the sheet uses the cleaned data.
Open the sheet you want to add to and choose "Update Sheet Data" from the sheet menu, or right click the sheet in your Workspace and choose "Update Data". Pick the second file, then choose "Add rows to this sheet" to append its rows, or "Add columns to this sheet" to place its columns next to the current ones. InstaCharts matches the columns and shows a preview before the update runs.
Yes. Use "Add rows to this sheet" to append the rows from a new export to the end of your existing sheet. Columns are matched by name first and by position second, and the charts built on the sheet keep their settings and show the combined data.
Yes. Each dashboard widget can read from its own sheet, so one dashboard can summarize several spreadsheets at once. Add a new sheet that belongs to the dashboard only, or pick an existing sheet from your workspace, then add charts, data tables, KPI and text widgets.
Yes. Add slicers to the dashboard header. Viewers pick values from a list or set a value or range for numbers and dates, and every chart and data table built from that sheet updates to show only the matching rows.
Yes. Check "Generate AI charts" when you upload a file, and AI suggests 3 charts with titles and captions, plus a data summary and insights that call out outliers and data quality issues. On a dashboard, describe what you want in the AI prompt bar and AI adds the matching widgets and filters. AI is optional, and the rule-based Recommended Charts run without sending your data to AI.
Yes. Connect a Google Sheet or Google Drive file and sync it on a schedule or whenever the original file changes, or update the sheet with a newer file from your device. Charts, data tables and dashboards built on the sheet show the new data.
Yes. Export the sheet as a CSV, Excel, TSV or JSON file to use it in Excel, Google Sheets or another tool. You can export every row or only the rows you select, and export your charts as PNG, SVG, JPG, WebP, PDF and PowerPoint files.
Yes. The free plan lets you upload, explore, transform and chart your data with up to 500 rows per sheet, and includes 5 AI credits a month. Paid plans starting at $10 per user per month remove the row limit and add scheduled syncing and dashboard sharing.
Start Exploring Your Data
InstaCharts makes data visualization easy, so you can build clear reports without design experience.