
For Reports and Publications
Share Your Charts and Reports Anywhere
InstaCharts turns your data into professional charts for reports, papers, presentations and online content. Export print-ready files, cite your sources and keep every chart on brand.
Publish
Embed Charts Anywhere You Publish
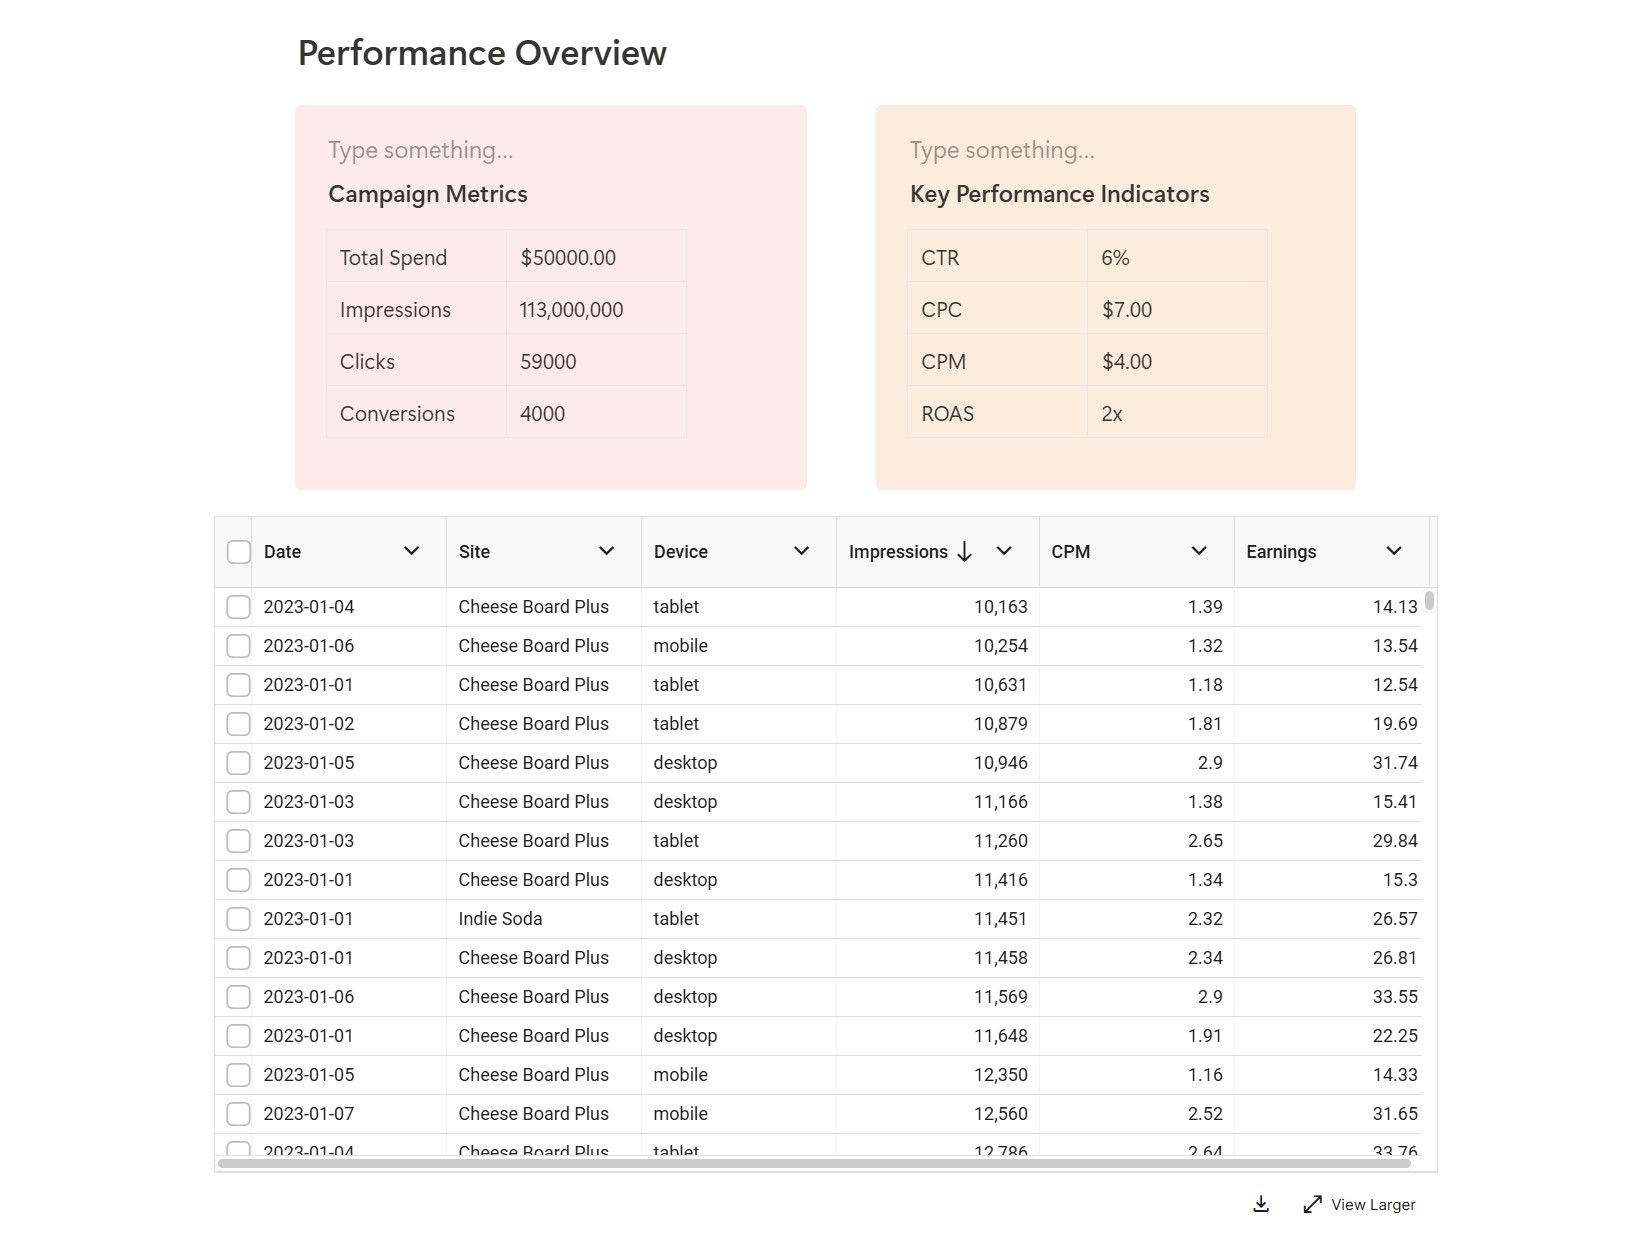
InstaCharts adapts to research papers, blog posts, and company dashboards alike. Flexible embedding options keep your visualizations looking consistent wherever they appear.
Formats
Ready to Publish
Upload your data and InstaCharts builds a chart from it automatically. Create clear visualizations in seconds:
- Responsive Design
- Interactive Charts - Web
- Static Charts - Print
- Real-Time Updates
- Vector PDF & SVG Files
- PowerPoint Slides
- PNG, JPG & WebP Images
- Captions & Sources
Export
Print-ready files in every format
Download each chart in the format your report, paper or presentation needs.
Six Image Formats
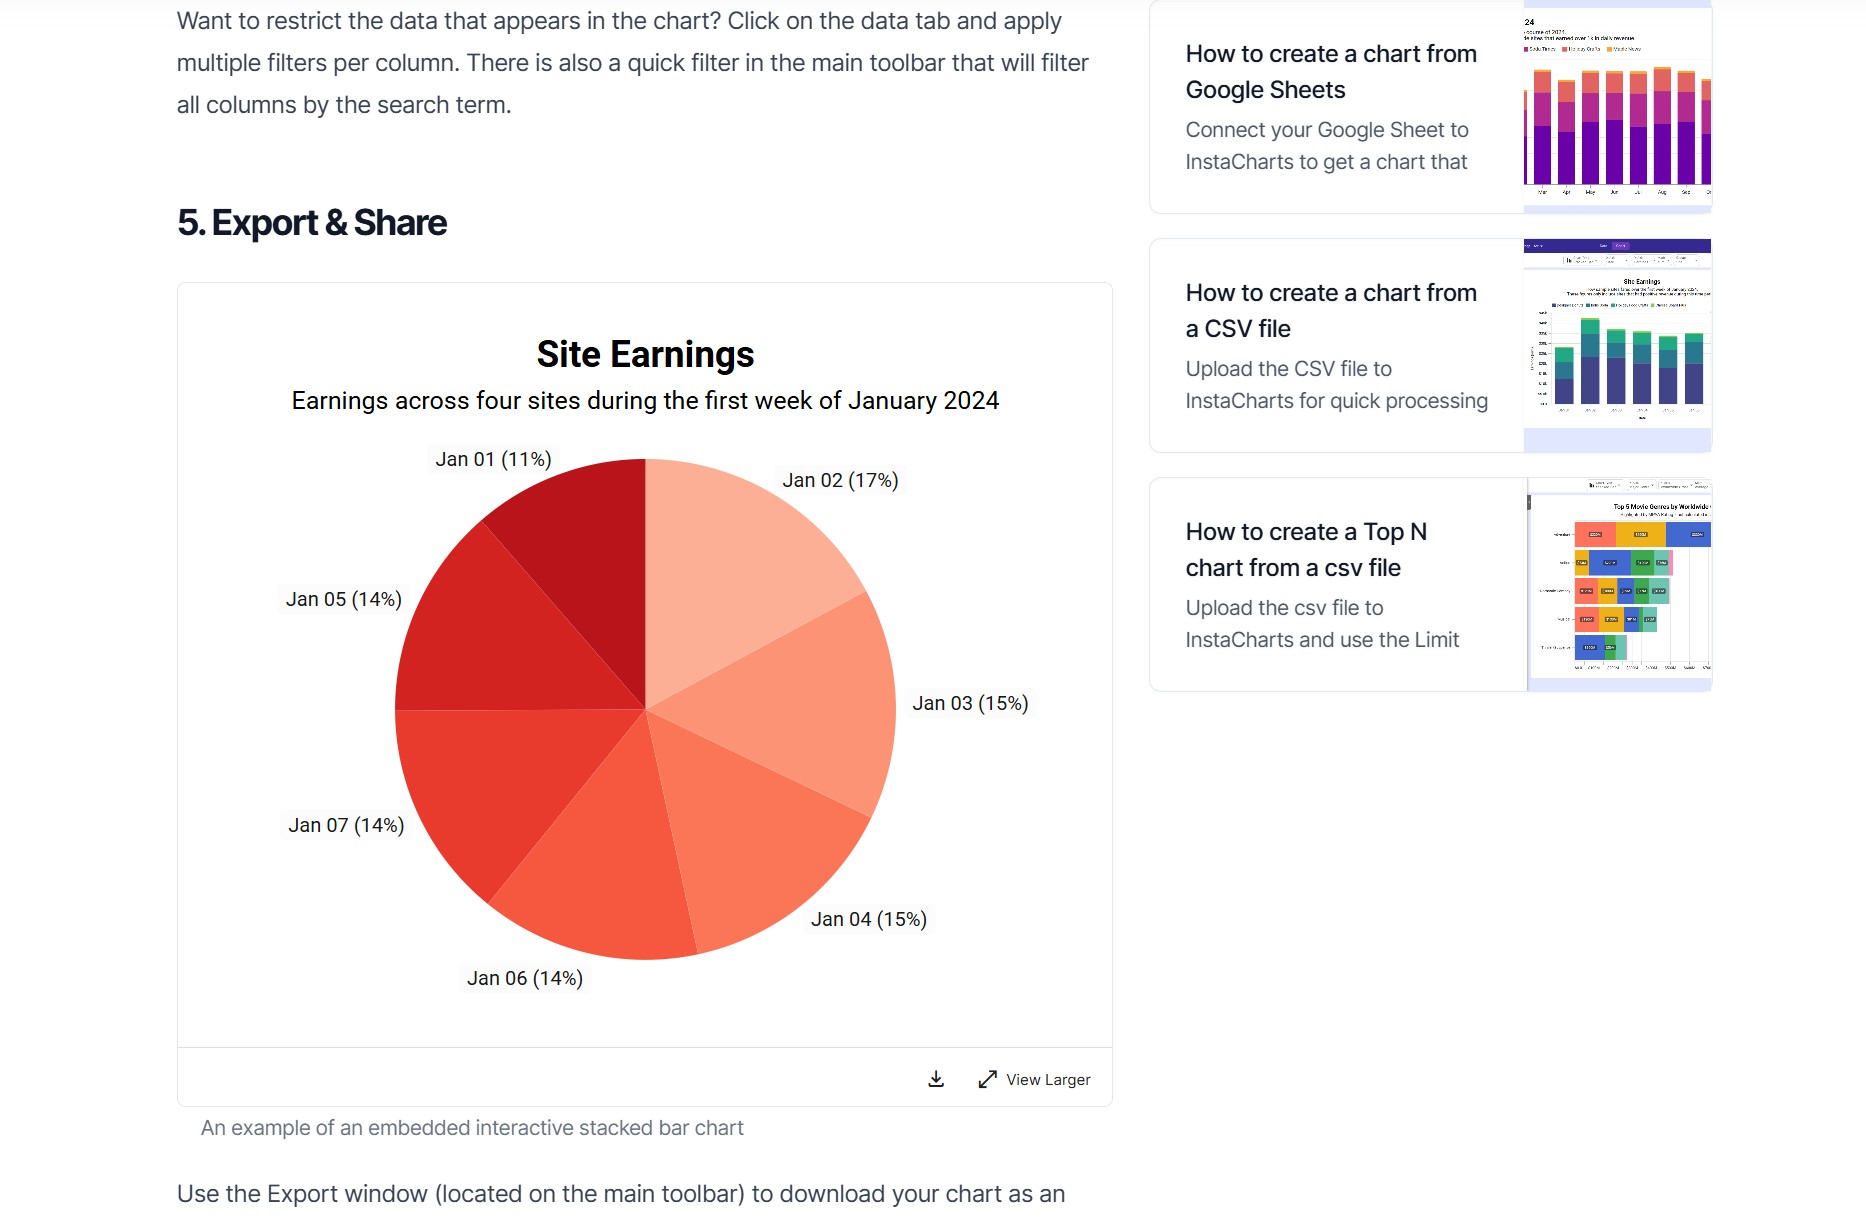
Export PNG, SVG, JPG, WebP, PDF and PowerPoint files, or send the chart straight to your printer.
Vector PDF & SVG
Vector files stay sharp at any size and keep the Google Fonts your chart uses.
Custom Chart Size
Set the chart width and height up to 2,400 pixels to fit a report column, a slide or a page.
Credibility
Charts your readers can trust
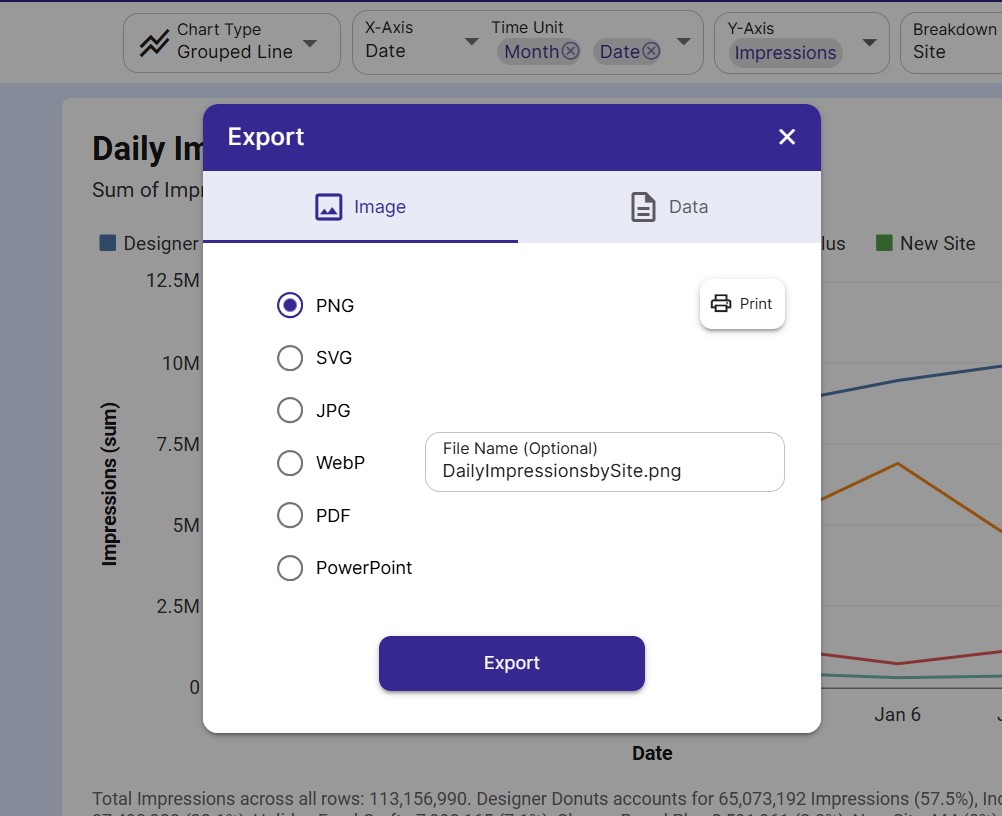
Give every chart a clear headline, a cited source and the statistics behind its trend line.
Caption & Source
Add a caption, source text and a source link so readers see where the numbers come from.
Trend Line Statistics
Write the equation, R², r and n of a line of best fit into the chart caption.
Auto Titles
InstaCharts writes a title and subtitle from the trends, percent changes and leading categories in your data.
Features
Built for Publishers and Teams
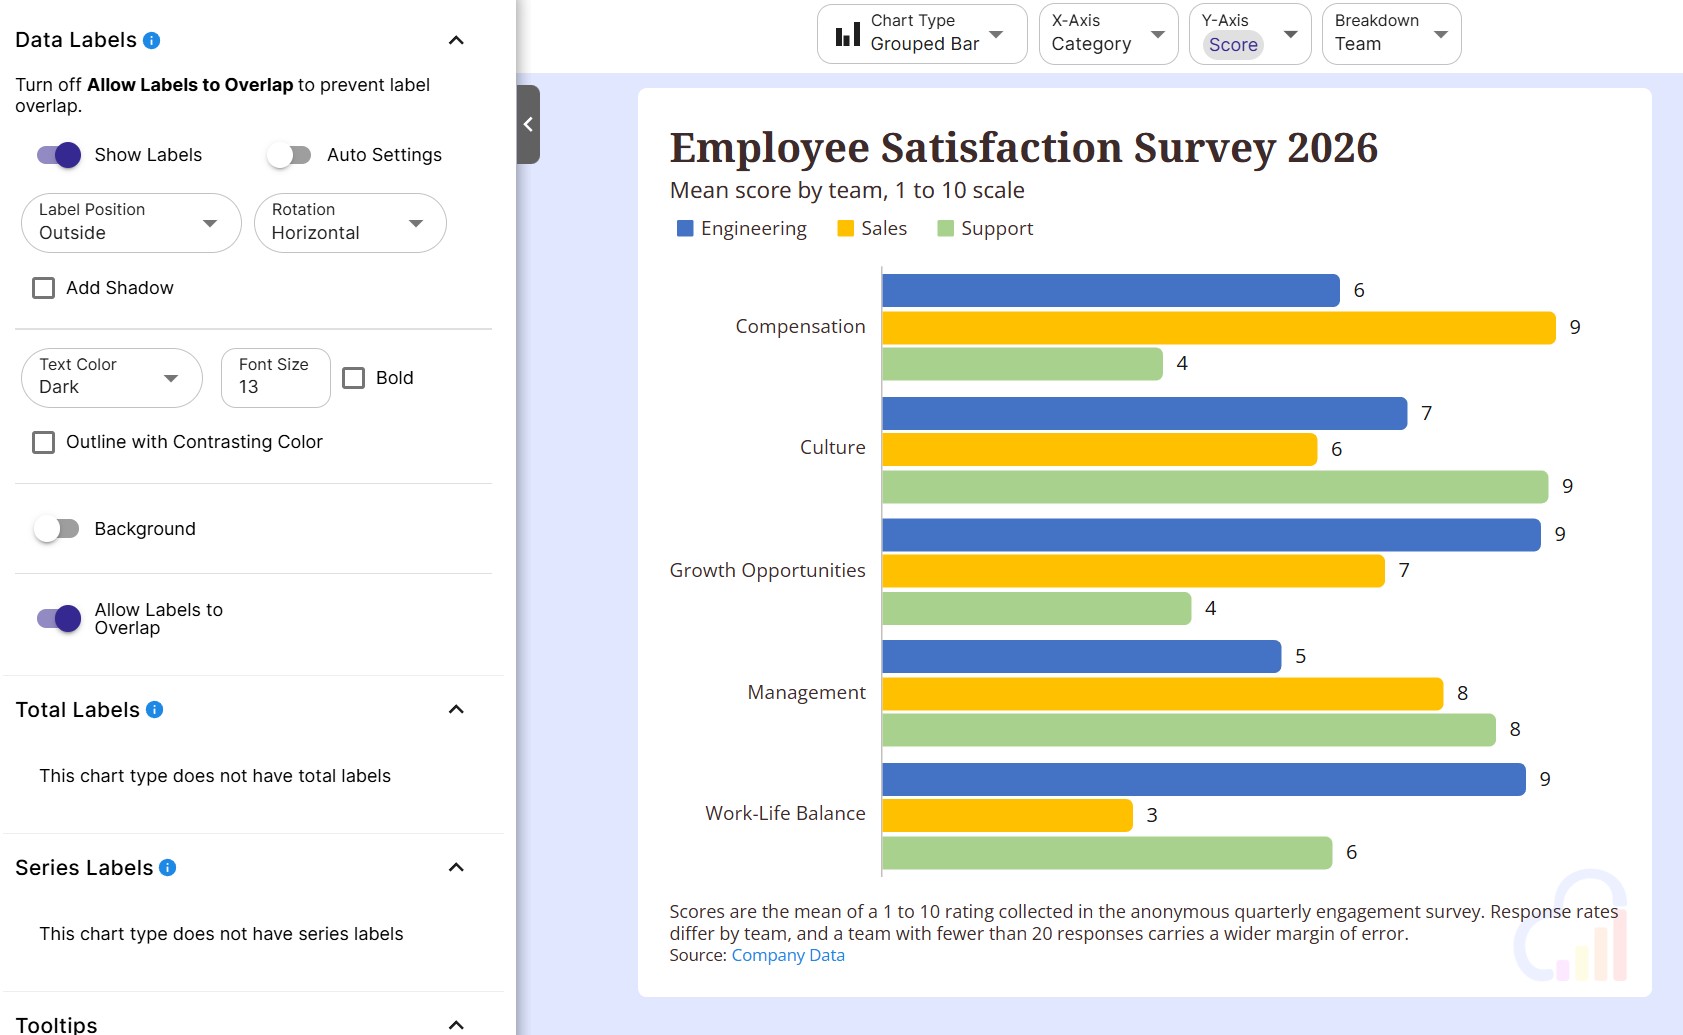
Data Labels
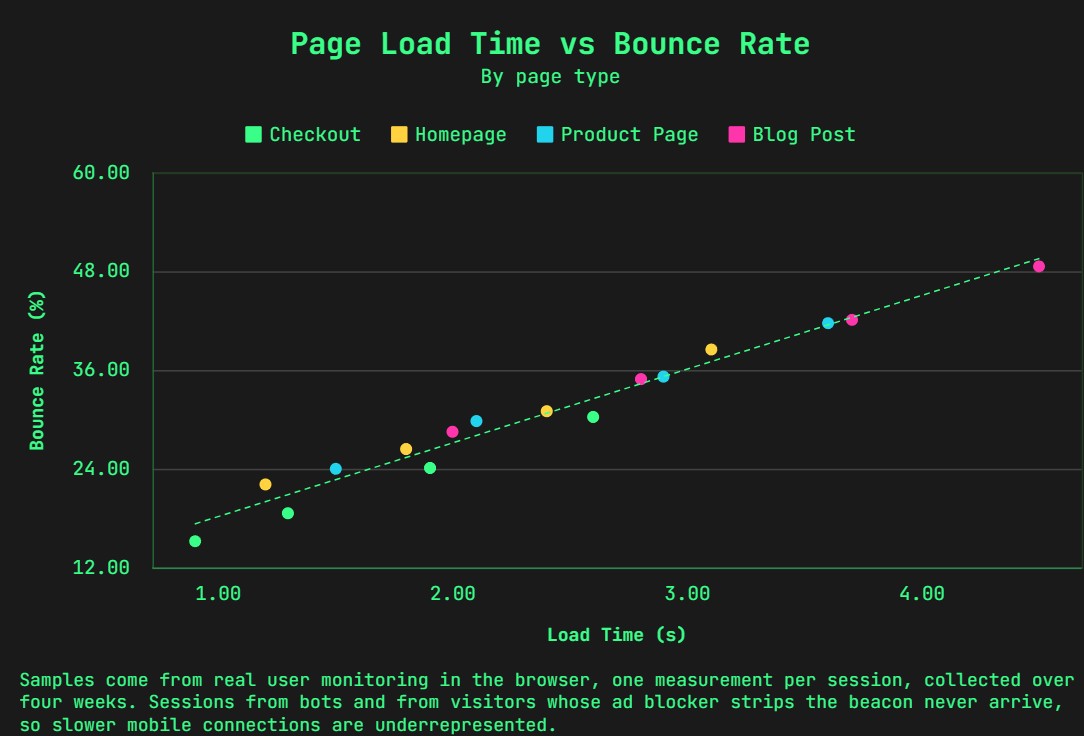
Show each value on the chart, add totals to stacked bars and label each series, so printed charts are easy to read.
Number Formats & Locales
Format values as currency, percentages or abbreviated numbers, with separators, symbols and dates for your audience.
Annotations
Highlight the key points in your chart with text annotations, and add logos and watermarks with image annotations.
10 Chart Themes
Style a chart in one click with themes such as Broadsheet for a newspaper look and Financial for market data.
Share Analytics
See how many people viewed each shared chart and which pages on the web are loading your embeds.
Export the Data
Download the full dataset or the plotted data as CSV, Excel, TSV or JSON for appendices and supplementary files.
Branding
Keep every report on brand
Set your brand once in the workspace, and every chart your team makes starts with the same look.
Workspace Chart Defaults
Set the fonts, colors, locales, axis styles and annotation styles that every new chart starts with.
Shared Brand Colors
Save your brand colors to the workspace so everyone on the team picks from the same palette.
Shared Logos & Images
Upload your logo once to Shared Assets and anyone in the workspace can add it to their charts.
Teams
Build reports together
Bring your writers, analysts and reviewers into one workspace with the right level of access.
Workspace Roles
Invite Admins to manage the workspace, Editors to create charts and Viewers for read-only access.
Private Sharing
Share a chart or data table with specific people by email, and remove access at any time.
Report Dashboards
Combine charts, data tables, KPI and text widgets into one dashboard and share it with your workspace.

Recurring reports
Refresh your report charts in minutes
Reuse the charts you already designed for weekly, monthly and quarterly reports.
Update From a File
Load this period's file to overwrite the data, append rows or add columns, and your charts keep their settings.
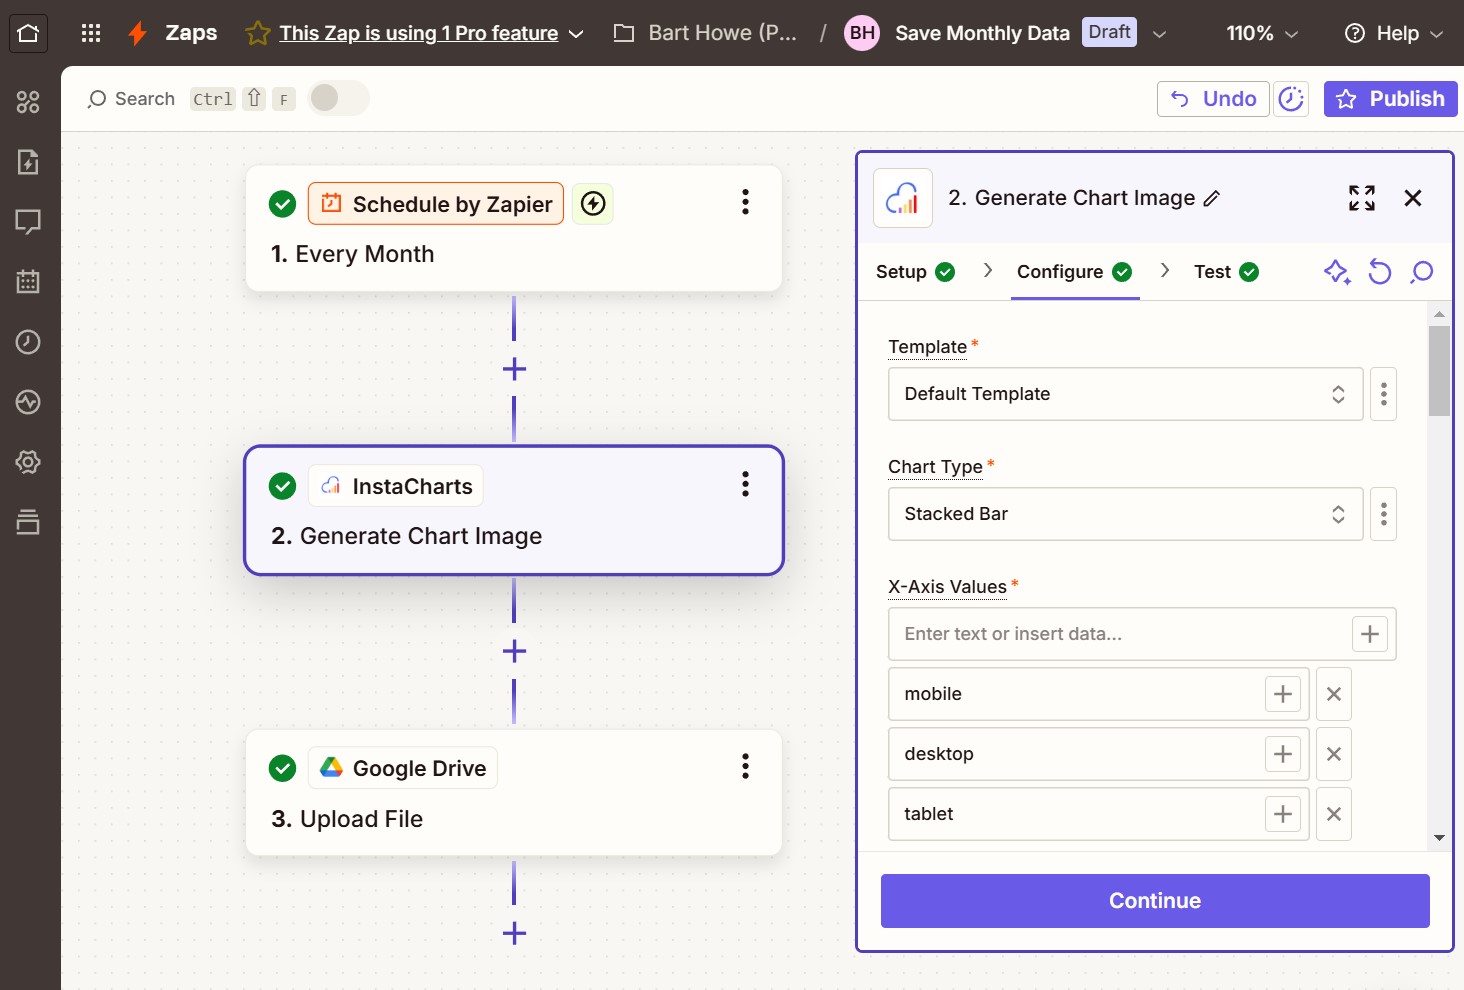
Automated Chart Images
Use the Zapier "Get Chart Image" action to deliver on-brand charts to Slack, Teams or email on a schedule.
Chart Templates
Turn a chart into a template and pass new data in the URL to create matching charts and images.
FAQs
Reports and Publications FAQs
Export any chart as a PNG, SVG, JPG, WebP, PDF or PowerPoint file from the Export dialog, and give the file a custom name. You can also send a chart straight to your printer with the Print button. The data behind a chart exports as a CSV, Excel, TSV or JSON file.
Use SVG or PDF for print, papers and journals. Both are vector formats, so the chart stays sharp at any size, and InstaCharts embeds the Google Fonts your chart uses so the text looks the same as it does on screen. Use PNG when a platform only accepts images.
Yes. Choose PowerPoint in the Export dialog to download the chart as a .pptx file, ready to open in PowerPoint or to copy into an existing deck. You can also export a PNG or SVG and insert it into Google Slides, Keynote or Word.
Open the size settings in the chart editor and set the chart width and height with sliders up to 2,400 pixels. Exports use the size you set, so you can match the column width of a report, a slide or a print layout.
Add a caption under the chart, along with source text and a source link to the original data. A cited source tells readers where the numbers come from and makes your chart ready for reports, articles and academic work.
Yes. Add a line of best fit and InstaCharts can write its equation, R², r and n into the chart caption. R² shows how much of the movement in your data the line explains, r shows the strength and direction of the relationship, and n is the number of points used.
Yes. Turn on Auto Titles and InstaCharts writes a title and subtitle from the trends, percent changes, high variation and leading categories in your data, such as 'Sales Increases 80% Over Quarter'. Turn Auto Titles off at any time to write your own.
Choose a number format for each axis, including currency, percentages, abbreviated numbers such as 1.2k and 3.4m, accounting style negatives and ordinals. Set the number and currency locale and the time locale so separators, currency symbols and dates match the country your report is for.
Workspace owners and admins can set Chart Defaults for the workspace, including fonts, colors, locales, plot and axis styles and annotation styles, so every new chart starts with the same look. Paid plans can also save shared brand colors and upload shared images, such as logos, for everyone in the workspace to use.
Yes. Add a logo, image or watermark to any chart with an image annotation. On paid plans, upload your logo once to the workspace Shared Assets and anyone in the workspace can add it to their charts.
InstaCharts includes 10 chart themes. Broadsheet gives charts a newspaper data graphic look, Classic and Studio suit business reports, and the Financial themes are designed for market data. Every theme can be adjusted after you apply it.
Yes. Invite people to your workspace as Admins, who manage members, settings and content, Editors, who create and edit charts and sheets, or Viewers, who have read-only access. Paid plans can also share a chart or data table privately with specific people by email.
Update the sheet behind your charts with this period's file to overwrite the data, append new rows or add new columns. Every chart on the sheet keeps its settings and shows the new numbers. Sheets connected to Google Sheets or Google Drive can sync on a schedule instead.
Yes. The InstaCharts "Get Chart Image" Zapier action renders any chart as an image with your theme, colors and fonts. Zapier can post it to Slack or Microsoft Teams, attach it to an email, or save it to Google Drive, and a schedule trigger can deliver it every day, week or month.
Yes. InstaCharts has an API for generating chart images and working with chart templates, secured with OAuth 2.0. Today it powers the official Zapier integration, and developers building their own integration can contact support@instacharts.io for API access.
Yes. Paid plans include share analytics for shared and embedded charts. See total views, views over the last 30 days with a day by day or month by month trend, and the top pages that load your embeds. Every table can be exported to CSV.
Yes. The free plan lets you create and export charts in every format with up to 500 rows of data per sheet, and charts include a small watermark. Paid plans starting at $10 per user per month remove the row limit and the watermark, and add brand colors, shared assets and share analytics.
Start Publishing Your Charts Today
InstaCharts makes data visualization easy, so you can build clear reports without design experience.