
For Small Business Owners
See Your Business Clearly and Share It Easily
Monitor sales, expenses, and growth with charts and dashboards you can build yourself in minutes, without a BI tool or a data team.
Your numbers
Your Numbers, Made Visual in Minutes
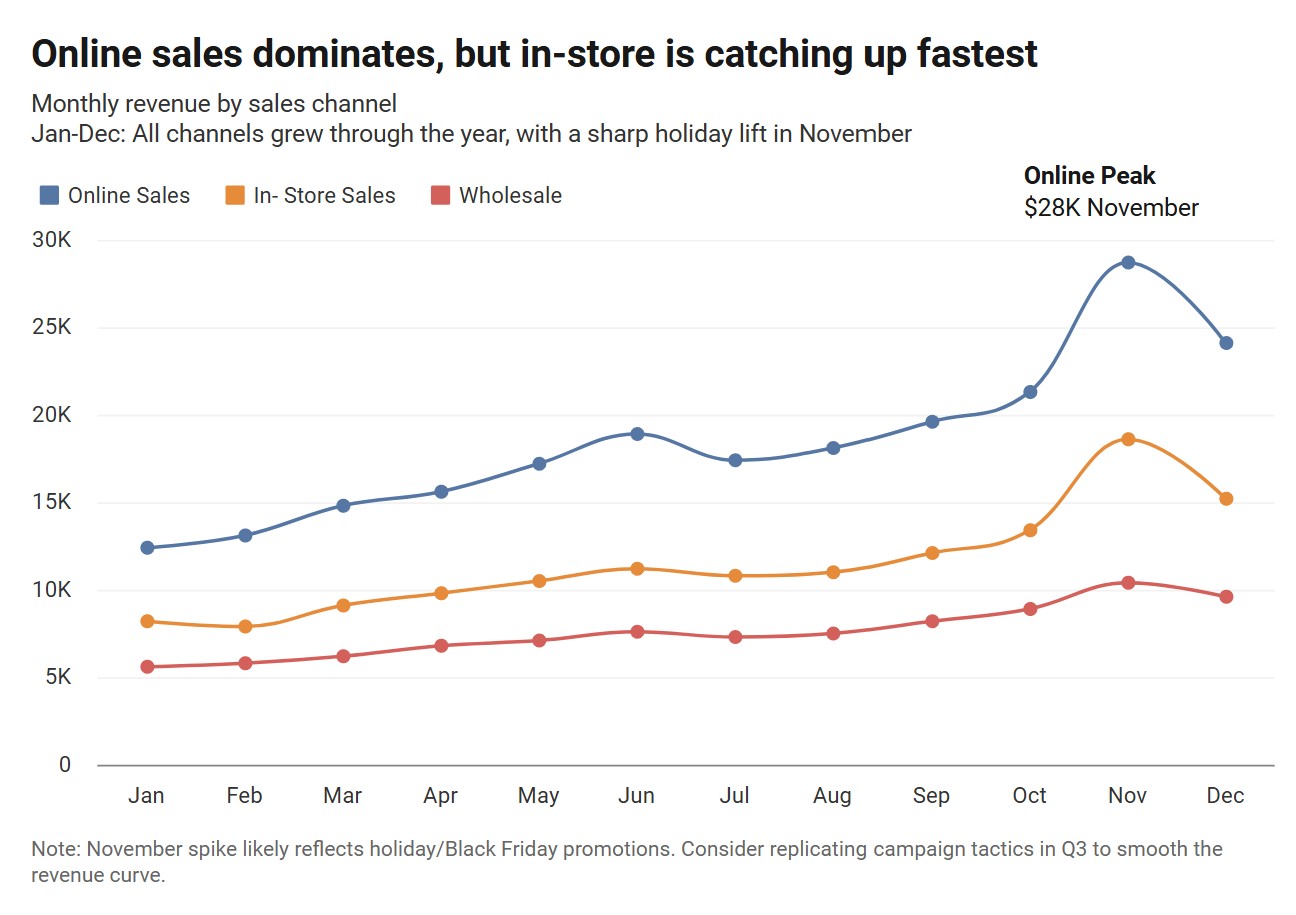
Paste your sales data, revenue figures, or customer counts and get a clear chart instantly. Track trends over time and spot changes early.
Share
Share With Your Whole Team
One link, anyone can view: Share charts with teammates, partners, or investors without them needing an account.
Drop charts into:
- Notion
- Google Slides
- PowerPoint
- Slack
- Confluence
- Business websites
- Investor decks
- PDF reports

Dashboards
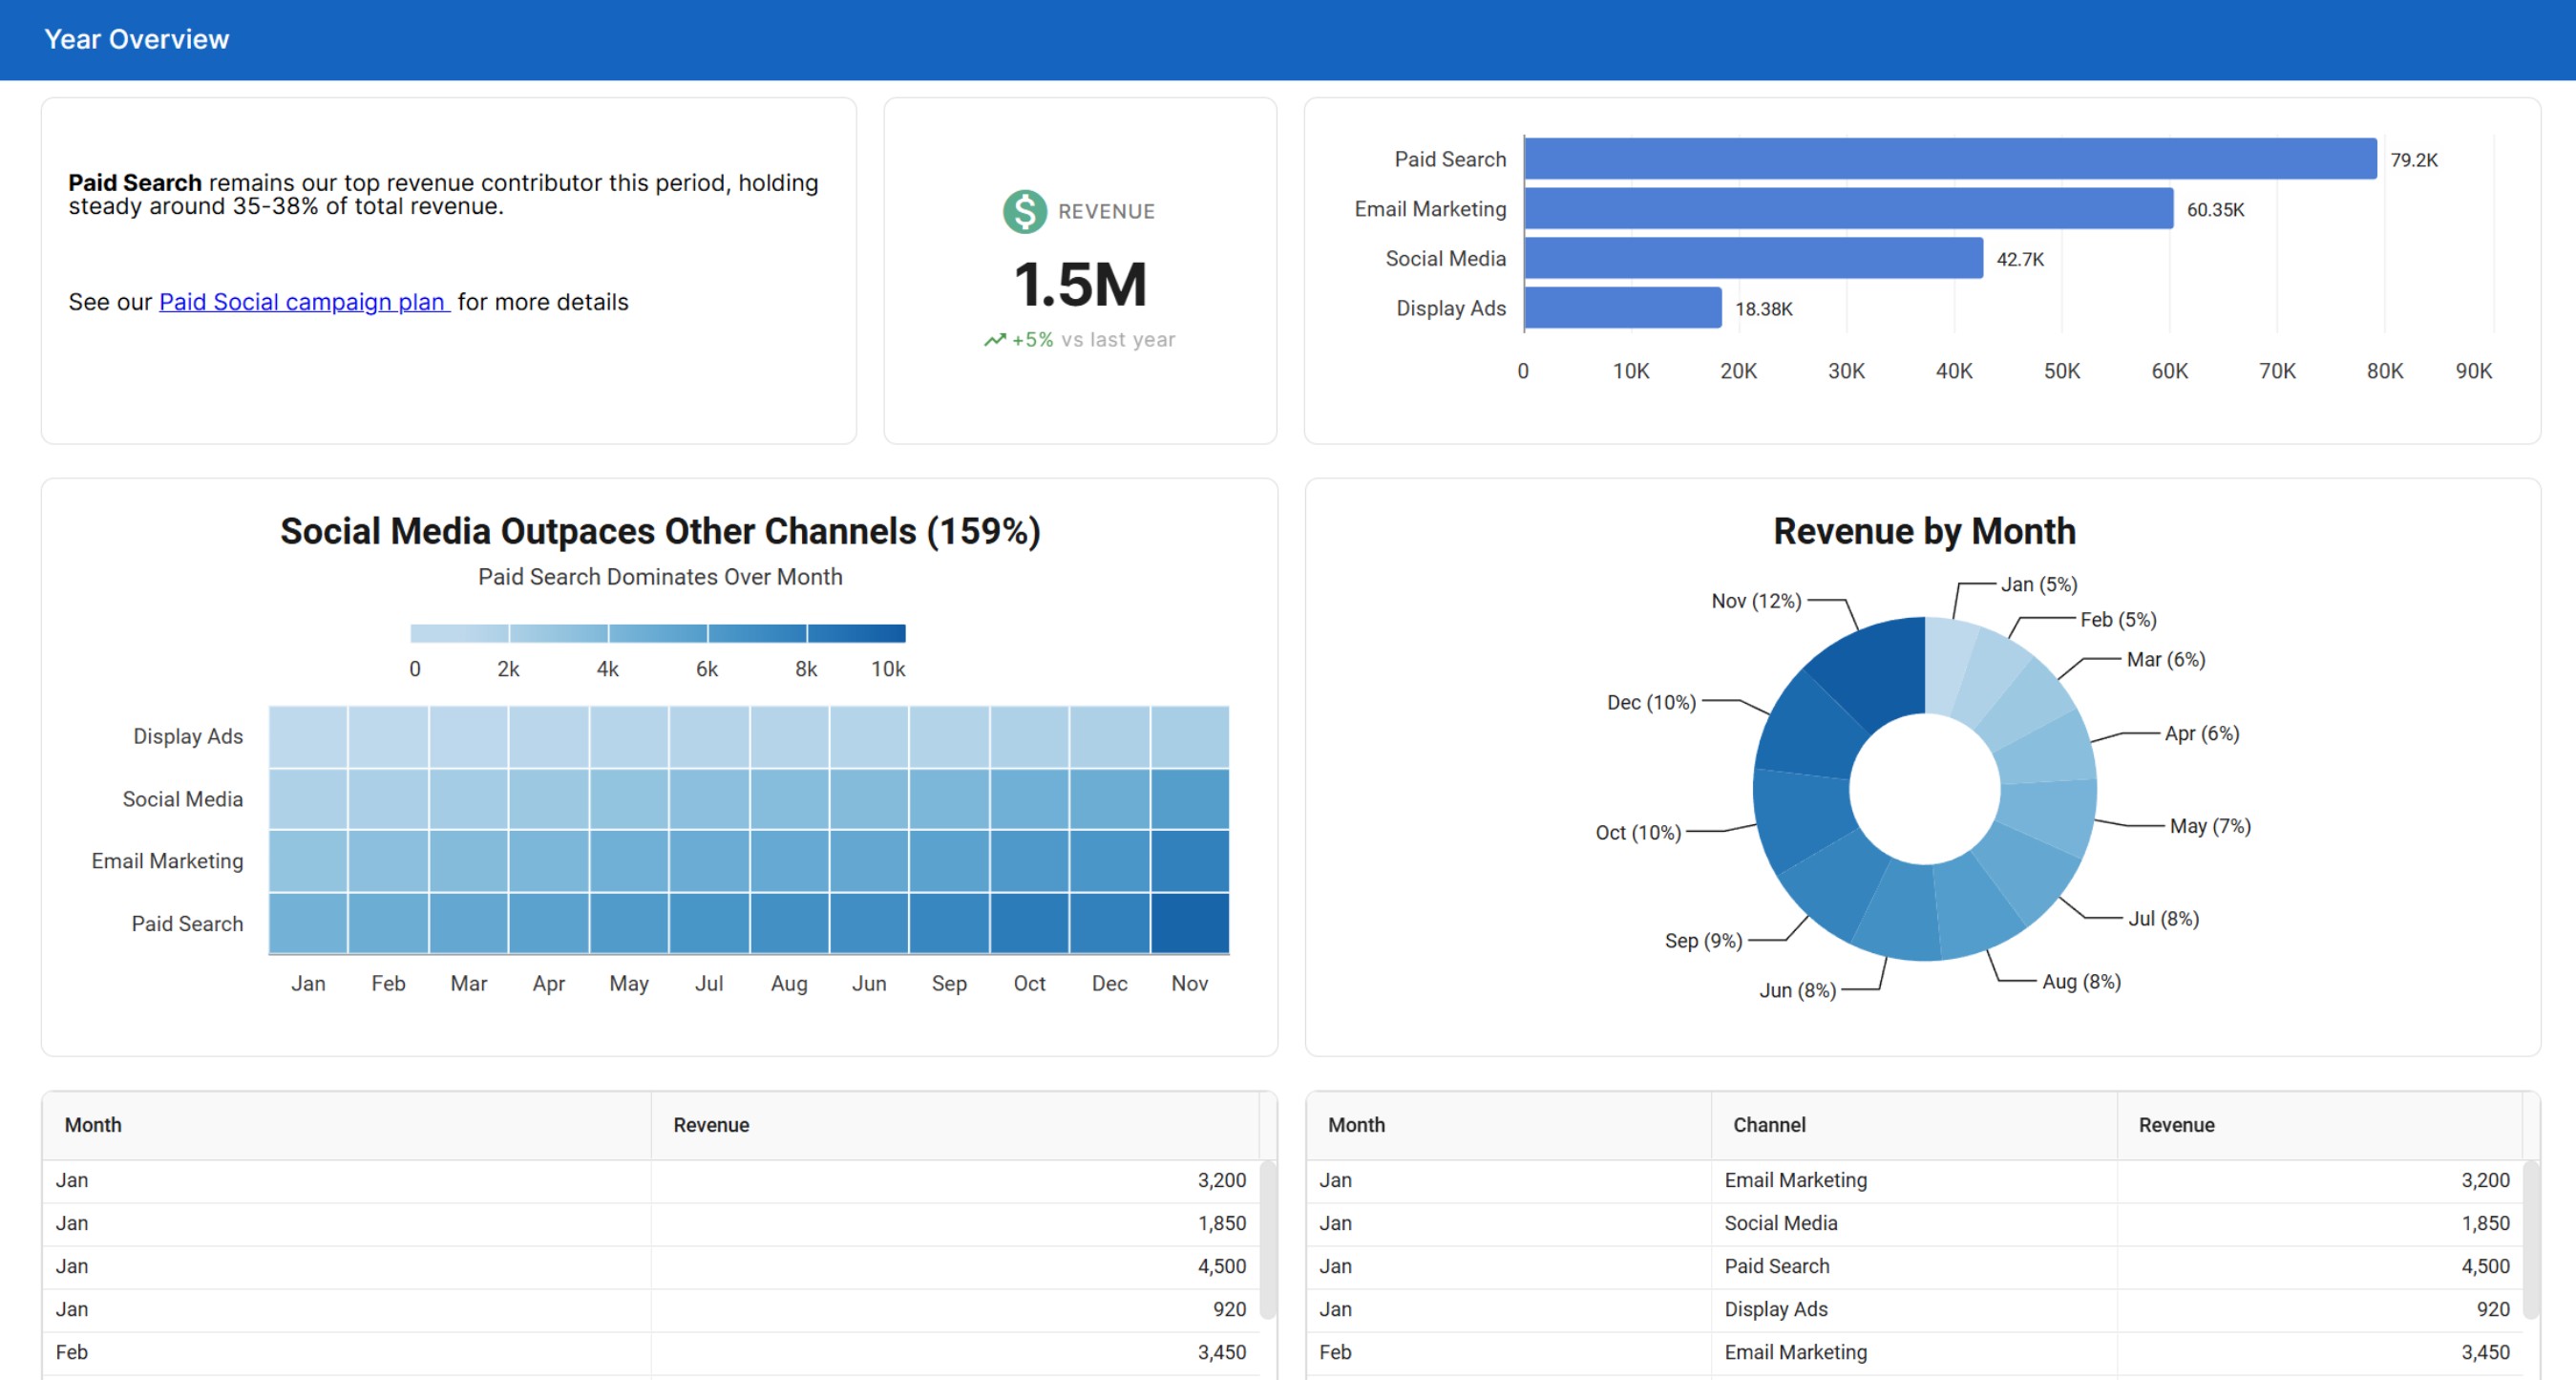
Your Whole Business on One Page
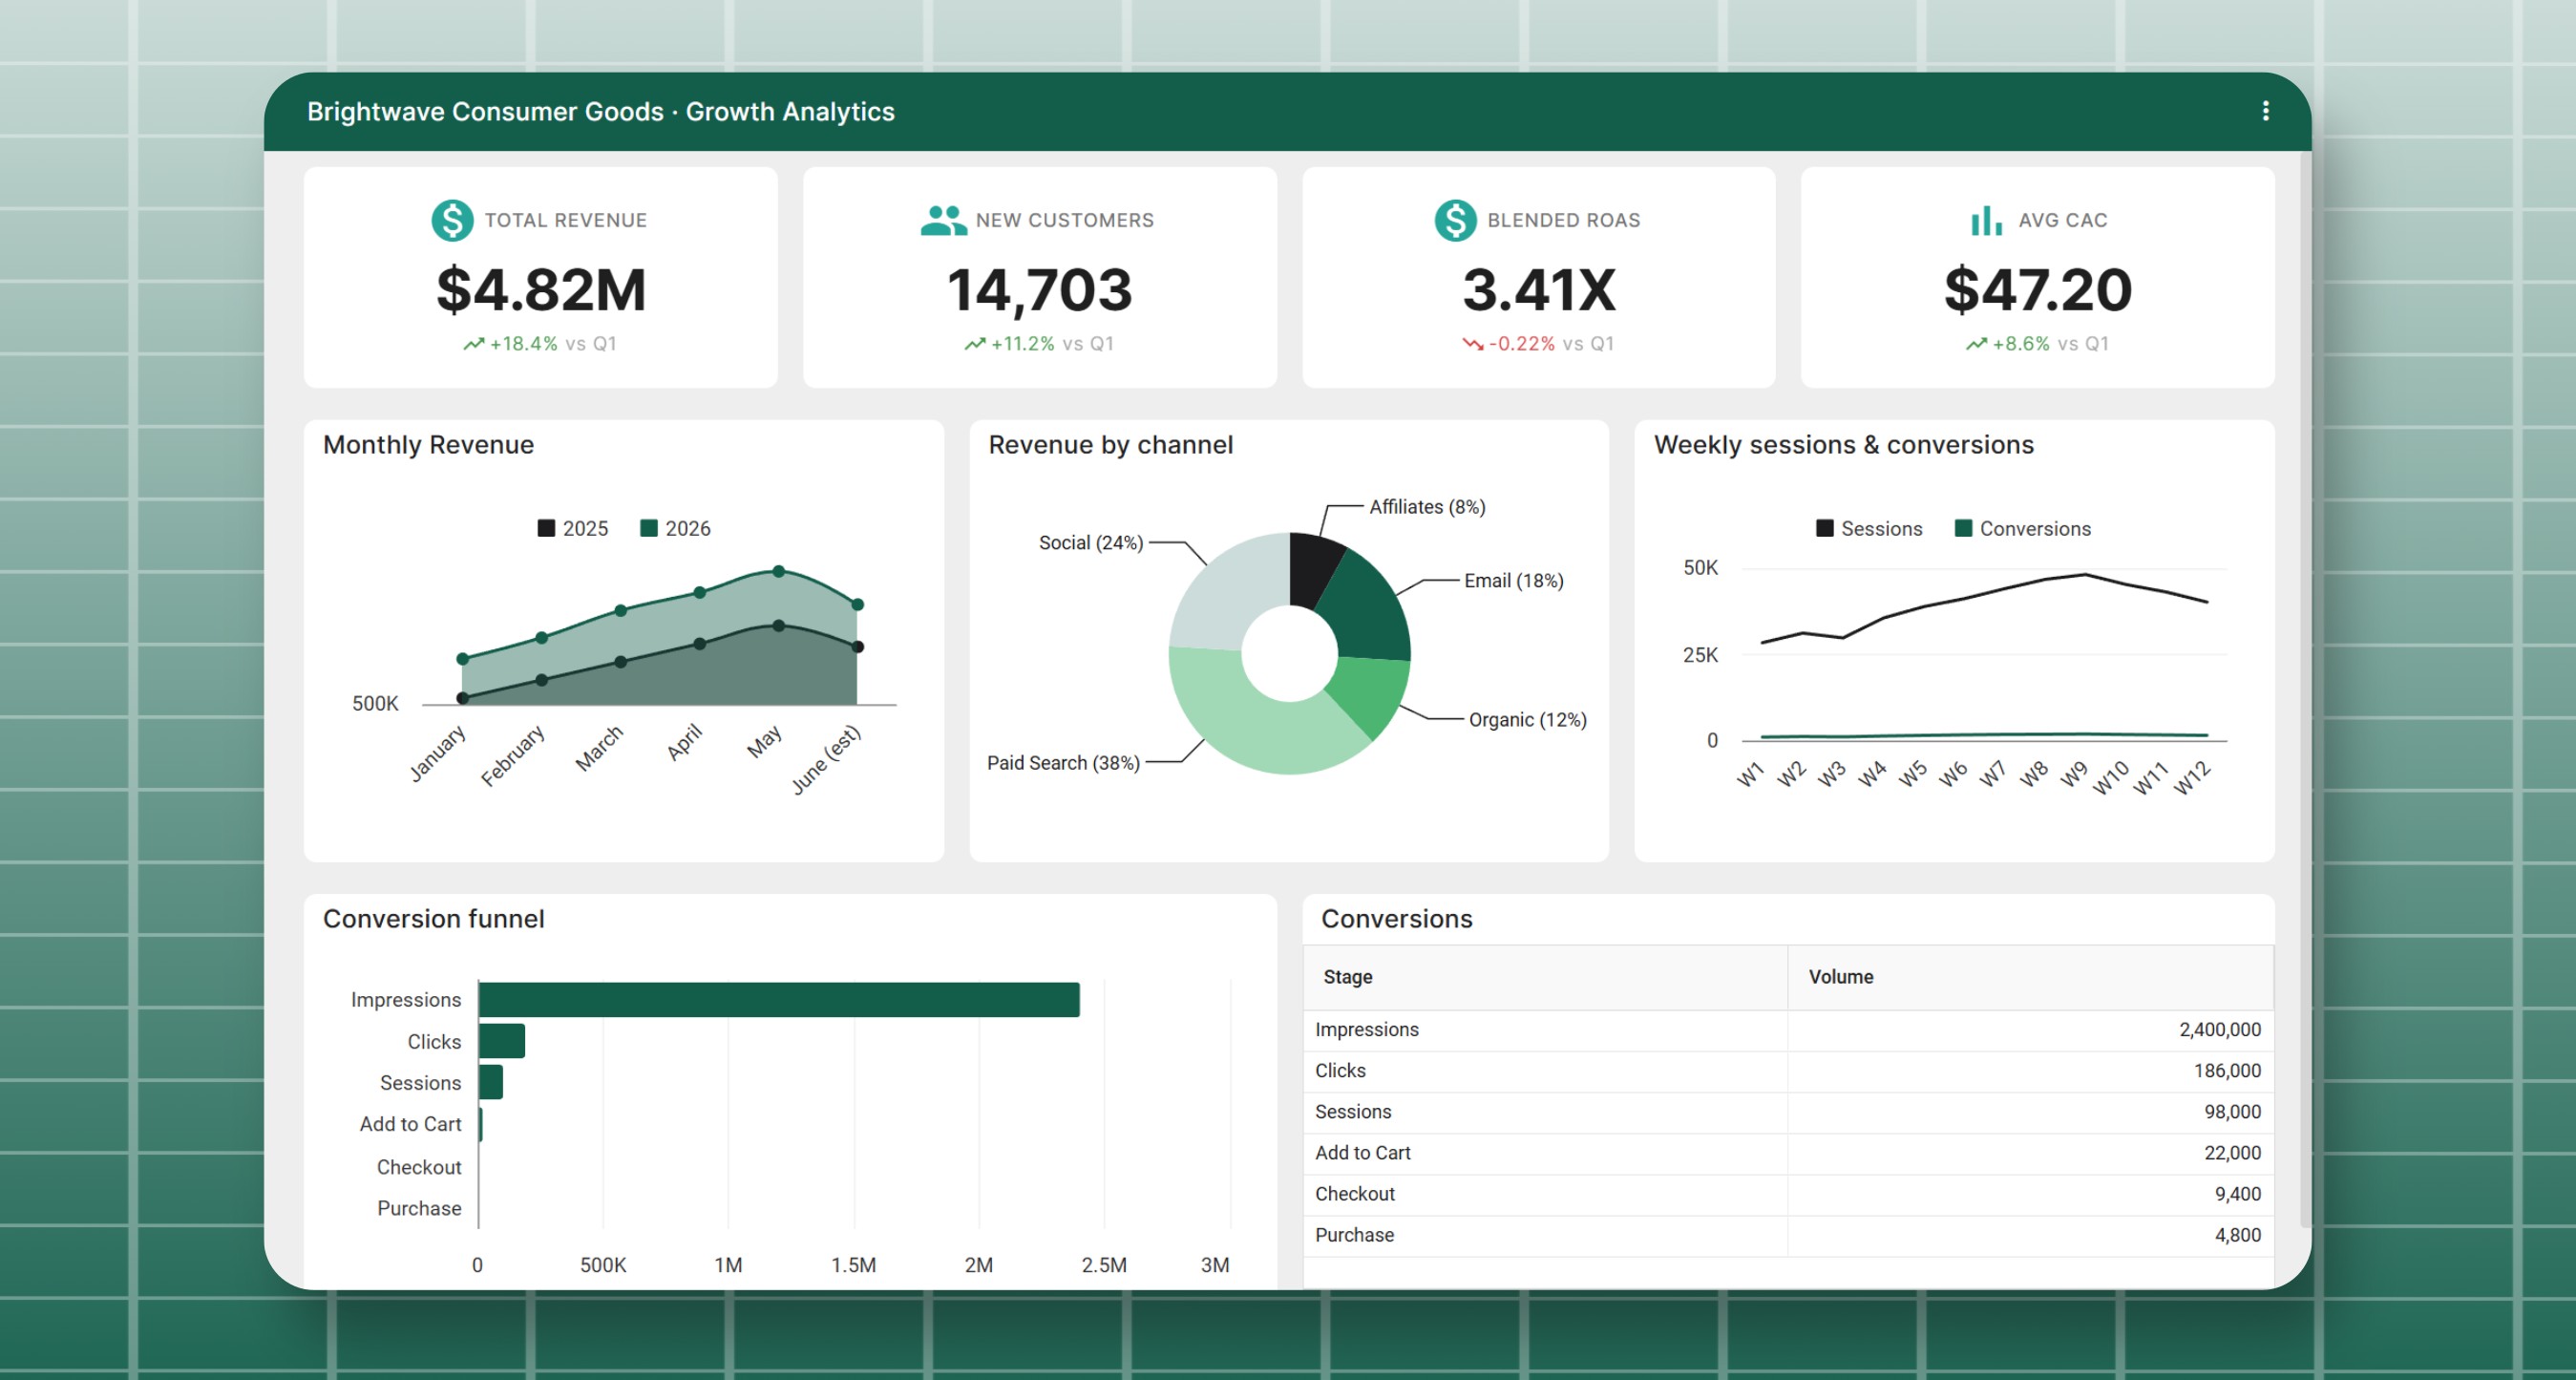
Build a business dashboard that puts sales charts, KPI widgets for revenue and orders, data tables and text widgets in one live view. Share it with your workspace so everyone starts the day on the same numbers.
KPI Widgets
Show revenue, orders or new customers in large numbers with a trend such as +12% vs last month.
Slicers by Location or Product
Filter every chart and table built from the same sheet by location, product, sales rep or date range.
Check It on Your Phone
Dashboards are responsive, so your numbers are easy to read on phones, tablets and desktops.
Money
Know where your money goes
Chart your cash flow, budget and expenses with charts made for business finances, like the live cash flow waterfall chart shown here, or a budget vs actual chart.
Cash Flow Waterfalls
See how monthly inflows and outflows rise and drop toward your ending balance.
Budget vs Actual
Compare planned and actual spending by month or category with grouped bars, lines or areas.
Currency Formats
Show values as currency, abbreviated numbers or accounting style negatives in your local format.
Cash Flow Waterfall Chart
LiveFeatures
Built for Business Owners
Import From Anywhere
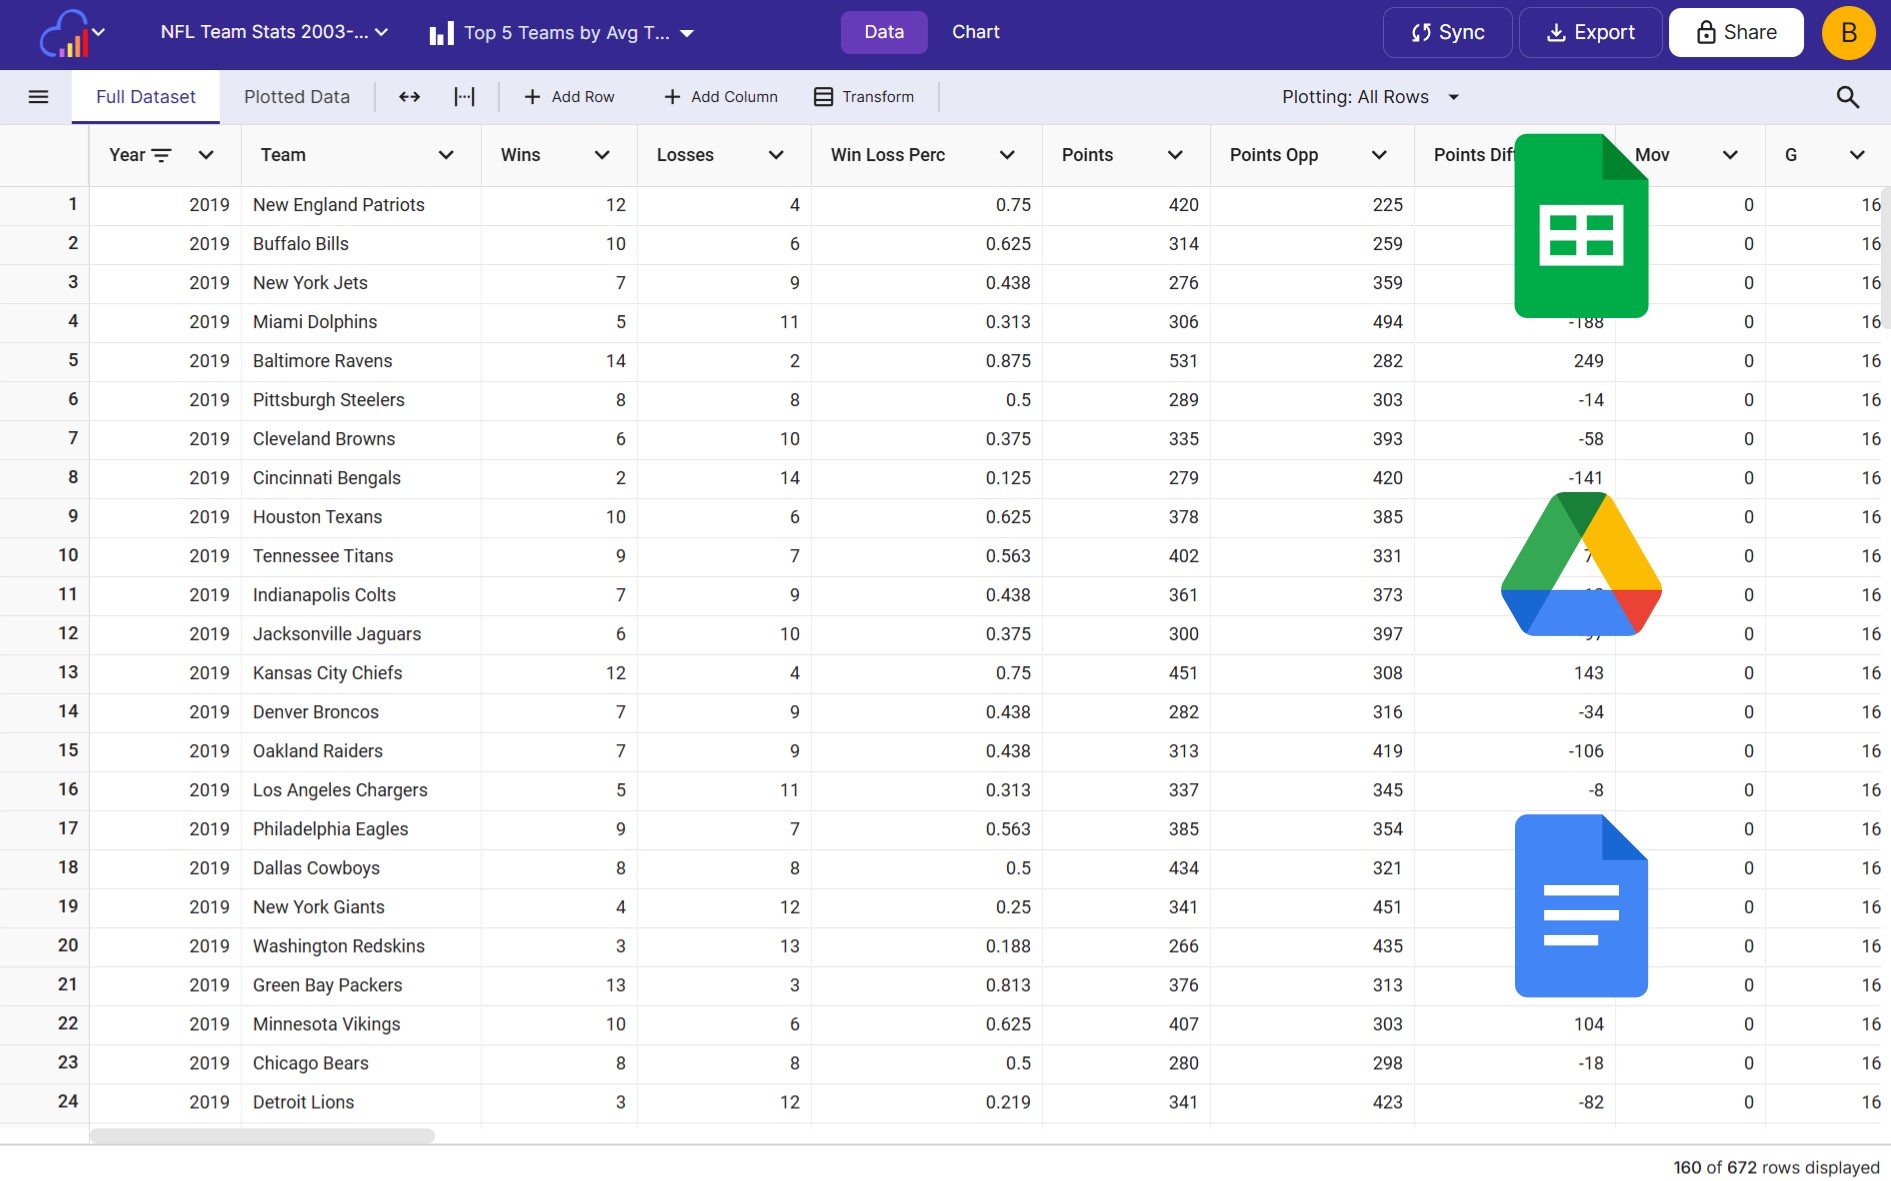
Bring in data from Excel, CSV, Google Sheets, or just paste it in manually. InstaCharts handles the rest.
Auto-Updating Charts
Connect to Google Sheets and your charts stay current automatically. Always show your latest numbers.
Professional Exports
Export as PNG, PDF, or PowerPoint for your board meetings, investor updates, or monthly team reviews.
Top Products & Customers
Limit a chart to your top 5 or top 10 items and sort by value to rank products, customers or locations.
Headlines Written for You
Auto Titles turns the trends and percent changes in your data into a headline such as "Sales Increases 80% Over Quarter".
Know When Reports Are Read
Share analytics counts the views of each shared chart and dashboard, so you know your investor update was opened.
Your tools
Connect the tools you already use
Keep your charts current with data from your spreadsheets, your payment processor and your CRM.
Google Sheets & Drive
Sync a Google Sheet or Drive file on a schedule or whenever the original file changes.
Stripe, HubSpot & Salesforce
Send new payments, deals and contacts into your sheets with the Zapier "Add Data Row" action.
Monthly Exports
Add this month's Excel or CSV export to your existing sheet, and every chart keeps its settings.
Team
Keep your team and investors in the loop
Give everyone the access they need, and send updates to the places your team already checks.
Free Viewer Seats
Paid workspaces include up to 5 free viewers for your accountant, advisors or investors.
Editor & Admin Roles
Teammates create and edit charts as Editors, and Admins manage members and settings.
Weekly Chart Updates
Post sales charts to Slack, Microsoft Teams or email on a schedule with the Zapier "Get Chart Image" action.
FAQs
Small Business Charts FAQs
Most small businesses track monthly sales and revenue with a line chart, sales by product, location or channel with a bar chart, and expenses by category with a donut chart. A cash flow waterfall chart shows how money moved in and out over a period, and a budget vs actual chart compares planned spending with real spending.
Upload your Excel or CSV file to InstaCharts, or paste the data in. Numbers, currencies and dates are detected automatically, and recommended charts are set up for your data right away. Pick the chart you want, adjust the colors and titles, then share or export it.
List each month's inflows and outflows in a sheet, create a bar chart and turn it into a waterfall in the Chart Options panel. Each bar rises or drops from the running total, so you can see which months added to your balance and which months drew it down. The cash flow waterfall chart maker includes a ready made example to start from.
Put your budget and actual amounts side by side in a sheet and create a grouped bar chart, with one bar for the budget and one for the actual amount in each month or category. The budget vs actual chart maker includes an example to start from, and you can switch to lines or areas with one click.
Yes. Combine sales charts, KPI widgets, data tables and text widgets into one dashboard using data from one spreadsheet or several. Arrange widgets with drag and drop, pick a theme such as Executive, or describe the dashboard you want and let AI add the widgets for you.
A KPI widget shows a headline number, such as monthly revenue or orders, in large, easy to read text. You enter the value and label and can add an icon, a color and a trend such as +12% vs last month. KPI widgets hold the values you enter, while chart and data table widgets update from your sheets.
Yes. Add slicers to the dashboard header for columns such as location, product or sales rep. Pick values from a list or set a date range, and every chart and data table built from that sheet updates to show only the matching rows.
Yes. Dashboards are responsive, so they display well on phones, tablets and desktops. Open your dashboard in a mobile browser to check your numbers from the shop floor, a client visit or on the road.
Yes. Connect a Google Sheet or Google Drive file and your charts stay connected to it. Paid plans can sync on a schedule, hourly, daily, weekly, monthly or whenever the original file changes, and free accounts can run 5 manual syncs a day. You can also update a sheet with a newer Excel or CSV export to overwrite the data or add new rows.
Yes. Use the InstaCharts "Add Data Row" action in Zapier to send new payments from Stripe, or new deals and contacts from HubSpot or Salesforce, into an InstaCharts sheet. Every chart and dashboard built on that sheet updates as the data arrives.
Share a chart with a public link that anyone can open without an account, or export it as a PDF or PowerPoint file for an investor update. Paid workspaces include up to 5 free viewers, so you can give your accountant, advisor or investors read-only access to your charts and sheets.
Yes. Invite teammates to your workspace as Editors, who create and edit charts and sheets, or Admins, who also manage members and settings. Paid plans can share dashboards with everyone in the workspace, with specific people or publicly with a link.
Yes. Use the InstaCharts "Get Chart Image" action in Zapier with a schedule trigger. Zapier renders your chart as an image and posts it to Slack or Microsoft Teams, or emails it to your team every day, week or month.
Create a bar chart of sales by product and use the Limit Items setting to show only the top 5 or top 10 products. Sort the chart by value to rank them from highest to lowest, and turn on horizontal bars to fit long product names.
Yes. Choose currency, percentages, abbreviated numbers such as 1.2k and 3.4m, or accounting style negatives for each axis. Set the number and currency locale so separators and currency symbols match your country.
Yes. Add your logo to any chart with an image annotation. Paid plans can also add a logo to the dashboard header, save brand colors to the workspace and upload shared images for the whole team to use.
The free plan lets you create, share and export charts with up to 500 rows of data per sheet. Paid plans start at $10 per user per month, remove the row limit and the watermark, and add scheduled syncing, dashboard sharing and up to 5 free viewers per workspace.
Start Tracking Your Business Growth Today
InstaCharts makes data visualization easy, so you can build clear reports without design experience.